ISSS608 2016-17 T1 Assign3 YANG Yuwei
Contents
Introduction
DinoFun World is a typical modest-sized amusement park, sitting on about 215 hectares and hosting thousands of visitors each day. It has a small town feel, but it is well known for its exciting rides and events. One event last year was a weekend tribute to Scott Jones, internationally renowned football (“soccer,” in US terminology) star. Scott Jones is from a town nearby DinoFun World. He was a classic hometown hero, with thousands of fans who cheered his success as if he were a beloved family member. To celebrate his years of stardom in international play, DinoFun World declared “Scott Jones Weekend”, where Scott was scheduled to appear in two stage shows each on Friday, Saturday, and Sunday to talk about his life and career. In addition, a show of memorabilia related to his illustrious career would be displayed in the park’s Pavilion. However, the event did not go as planned. Scott’s weekend was marred by crime and mayhem perpetrated by a poor, misguided and disgruntled figure from Scott’s past. While the crimes were rapidly solved, park officials and law enforcement figures are interested in understanding just what happened during that weekend to better prepare themselves for future events. They are interested in understanding how people move and communicate in the park, as well as how patterns changes and evolve over time, and what can be understood about motivations for changing patterns.
Dataset
- DinoFunWorld_CommData.zip consist of in-app communication data over the three days of the Scott Jones celebration.
- DinoFunWorld_MoveData.zip consists of three days park movement data. The park movement datasets are in csv format.
- DinoFunWorld_LayoutMap.zip consists of a jpg file.
- DinoFunWorld_Website.zip consists of webpages of DinoFun World Park.
Data preparation
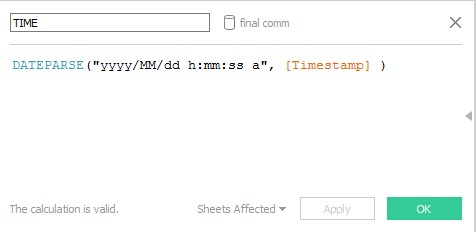
By using concatenate function in JMP to combine the three days’ communication dataset into one file, in the meanwhile, also combine the three days’ movement dataset into one file. For the combination dataset of communication, we use this to create two new datasets in order to importing dataset into Gephi. One is for node, the other is for edge. In node dataset, we have ID and Value two columns. In edge dataset, we have Source, Target and Weight three columns. When I import this big dataset into Tableau, I also create a new calculation filed named “TIME” by using DATEPARSE function to convert string to a date in specified format.
For the combination dataset of movement, I also create a new calculation filed named “TIME” by using DATEPARSE function to convert string to a date in specified format. In the meanwhile, I change X into longitude, Y into latitude. At last, I add the park map as a background image.
Task
Task 1
Task1: Identify those IDs that stand out for their large volumes of communication. For each of these IDs.
- Characterize the communication patterns you see.
- Based on these patterns, what do you hypothesize about these IDs?
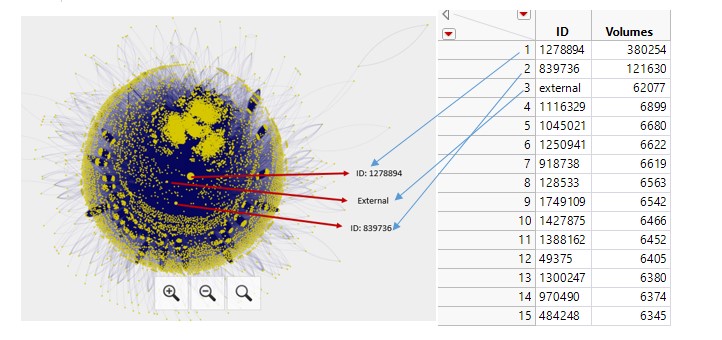
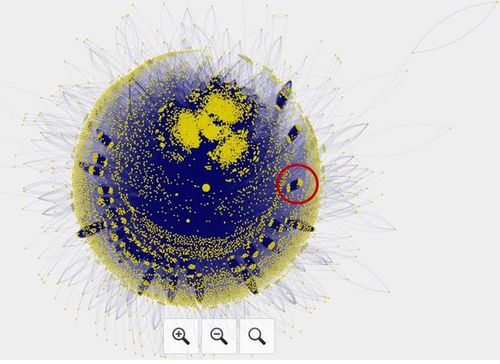
The data shows ID 1278894, ID 839736 and external have a large volumes of communication. I import the combination dataset of communication into Gephi, then I got the graph below. We can easily find that the biggest point represents ID 1278894, the second biggest point represents ID 839736, the third biggest represents External.
ID 1278894
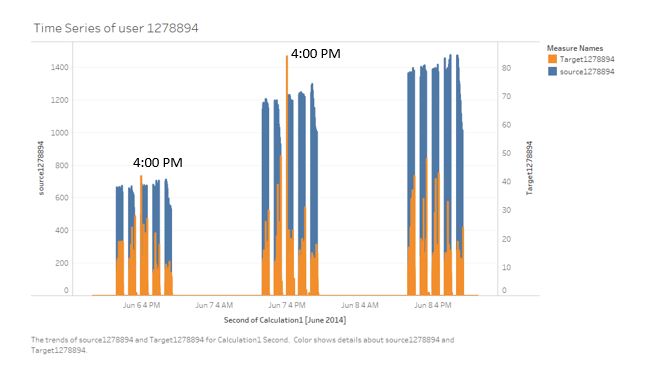
- At 12:00 PM each day, this person will send out a large amount of messages. Then it will continue about one hour (end at about 12:55 PM). After the first sending, one hour later (2:00 PM) this person begin to send again, and end at 3:00 PM. It will repeat 5 times a day.
- We also can find that after this person send a large amount of messages. It will have some of people reply to 1278894. So the pattern of 1278894 received message is like the pattern of 1278894 sent message. But for the pattern of 1278894 received message on Friday and Saturday, there is always a peak at 4:00 PM. I think maybe there is an event need people to interact at 4:00 PM.
- We can hypothesize that this person is a park employee simply sending out information to all the park visitors. Since the amount of messages the person sends seem to fluctuate with the amount of people.
ID 839736
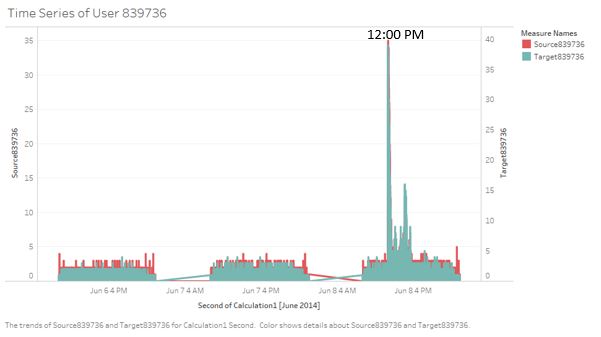
- This person receives and sends messages from everyone, throughout the day.
- This ID connected with almost every visitor that visited the park each day. This person does not have much of a pattern with its messages, but this person sends between 5 and 20 messages every minute of each day. The only exception to this occurs at 12:00 on Sunday, when there is a peak of all three days.
- This ID connected with almost every visitor that visited the park each day. We hypothesize this person is also a park employee who deals with safety and security issues.
Task 2
Task2: Describe up to 10 communications patterns in the data. Characterize who is communicating, with whom, when and where. If you have more than 10 patterns to report, please prioritize those patterns that are most likely to relate to the crime.
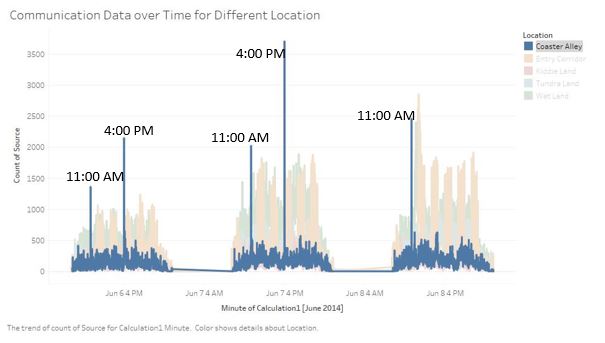
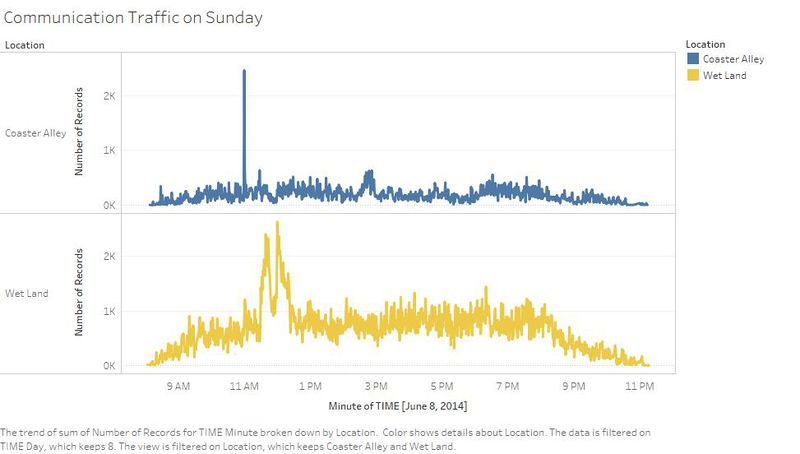
- Based on the graph below, we can easily find that there is a peak in communications from Coaster Alley at 11:00 AM and 4:00 PM on Friday and Saturday. From this we can consider that at that time people have high desire to share with their friends. We can hypothesize the Scott Jones’ show begins at 11:00 AM and 4:00 PM, since the communication traffic has a great increasing in this place.
- But on Sunday, there is only one peak at 11:00 AM. We can hypothesize that there is some emergent situation occurred on Sunday lead to the show cannot be performed successfully. So the mayhem perpetrated happened on Sunday.
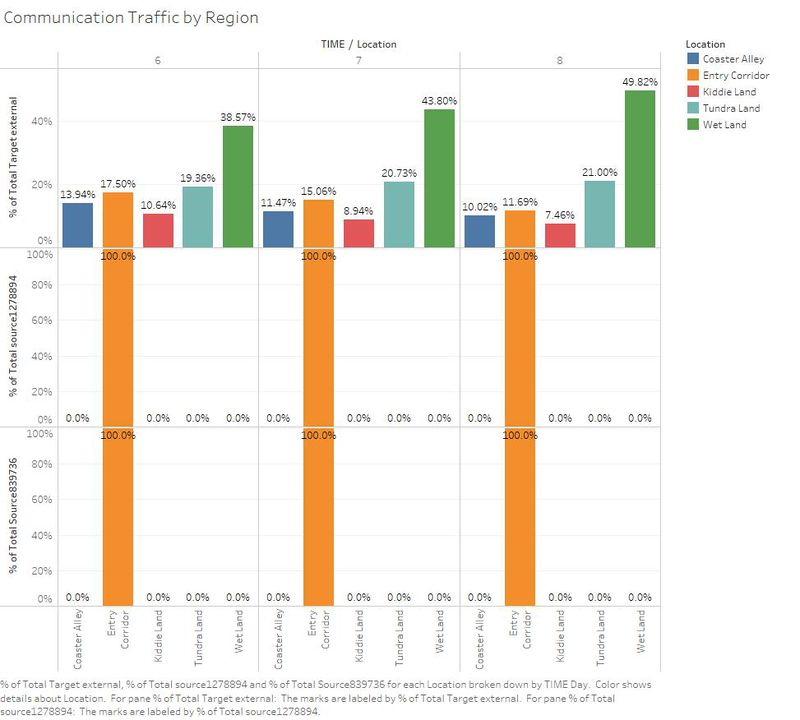
- Based on the graph below, we can see that the most messages sent to an external person come from the Wet Land during each of the three days, especially on Sunday. Because Wet Land is the only exit of stage in Coaster Alley area.
- The ID 1278894 and ID 839736 only send messages at Entry Corridor. We can firmly believe that these two person are the staff of the park.
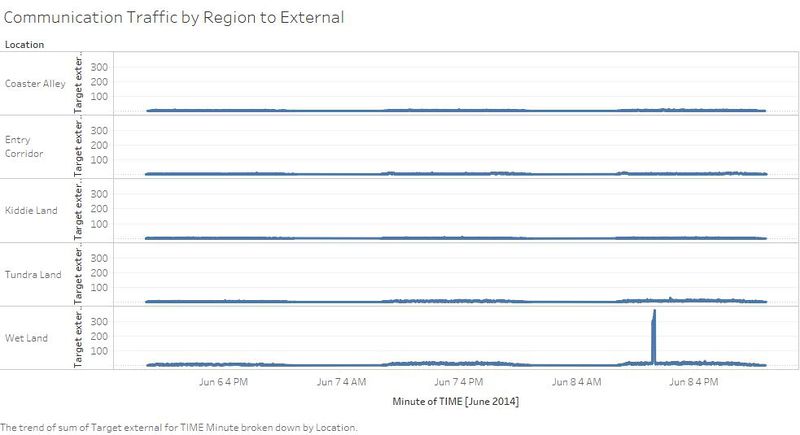
- From this graph below, there is an outstanding point. We can see that the external have received a large amount messages on Sunday. And all of these messages were sent at Wet Land around 11:30 AM to 12:00 PM. We can consider that after the emergency happened people moved out immediately from Coaster Alley to Wet Land and try to contact outside on matter what the reason (maybe want to tell their family or friend they were safe, maybe want to tell the people outside do not come to the park.)
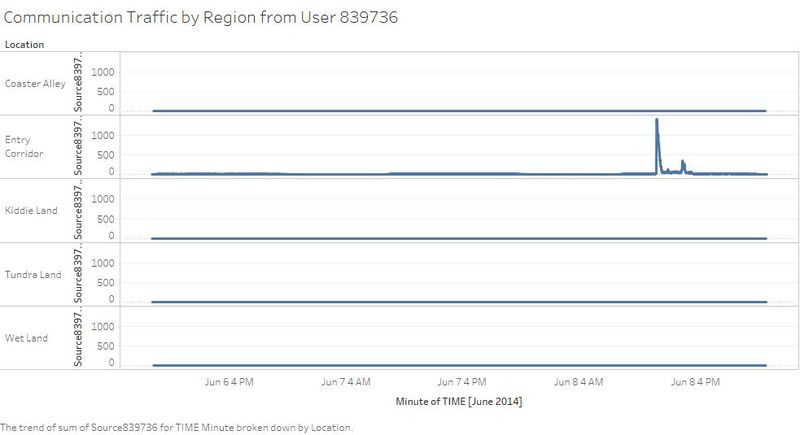
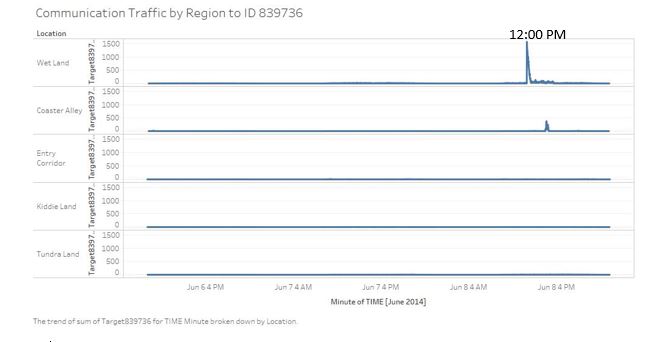
- Based on the graph below, we can see that ID 839736 sent a large amount of messages on Sunday 12:00 PM (after the crime occurred), so we can firmly believe that ID 839736 is a park staff who take charge of the safe and security issues.
- The graph below is a picture about communication traffic on Sunday at Coaster Alley and Wet Land. We can easily find that there is a time different between the two places. At 11:00 AM, there is a peak at Coaster Alley. Because the mayhem perpetrated was happened at stage in Coaster Alley first. People sent a lot of messages at that time. Then after a while (about 11:30 AM), the number of messages in Wet Land begin to increase, due to Wet Land is the only exit of the stage. So after mayhem perpetrated broken out, people need to leave through Wet Land. Therefore, there is an increasing number of messages in Wet Land after the mayhem perpetrated broken out.
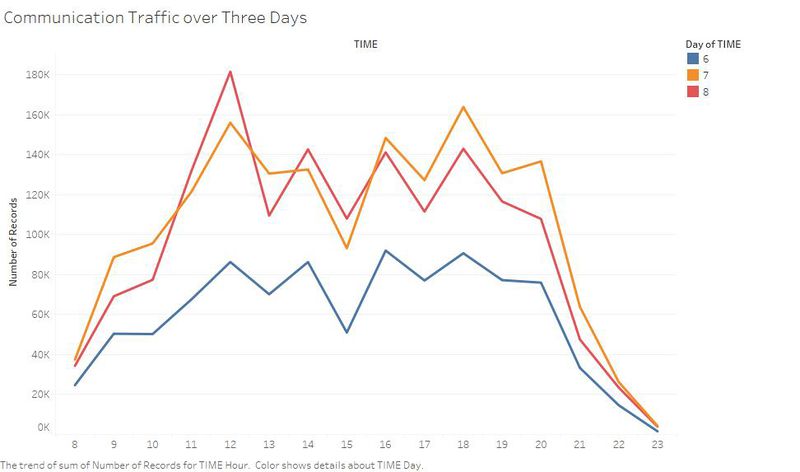
- Based on the graph communication traffic over three days, we see that the communications trend is similar on Friday and Saturday, but the Sundays communications between 11:00 and 12:00 is quite larger than others.
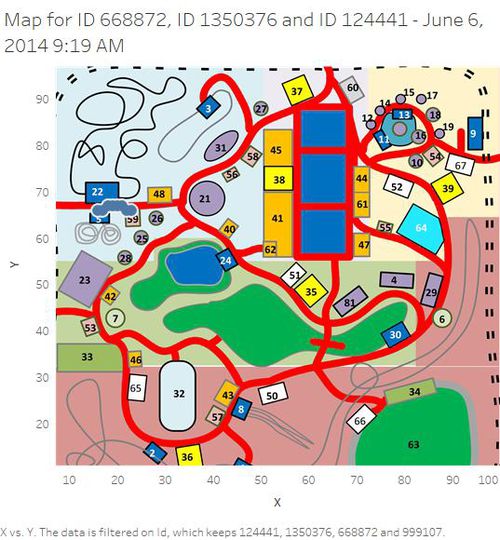
- According to the graph in Gephi, we can see that there are some small clusters always connect with other small cluster. So I identify some of them in the map we can see that they are always have the same path. We can consider that them as a tour group and they were travel together. Such as ID 668872 ID 1350376 and ID 124441. They only communicate with their own group person.
- There are total of 11,374 unique IDs. Among these visitors, there is 62% of the visitors only visited the park on 1 day, 22% of the visitors visited the park over 2 days, and 16% of the visitors (or 1,813 persons) went to the park on all 3 days.
Task 3
Task3: From this data, can you hypothesize when the vandalism was discovered? Describe your rationale.
- Based on the communications patterns above, we can get the information that the crime was occurred around 11:30 AM on Sunday. Because the high volume of communications starting from 11:00 AM on Sunday.
- In the meanwhile, according to the communications pattern, we know that ID 839736 who is a park staff take charge of the safe and security issues. Seeing the communication pattern about ID 839736 received, the communications numbers suddenly become quite large at 12:00 PM in Wet Land. We can hypothesize mayhem perpetrated information spread out around the Wet Land.
Tool Utilized
- Tableau
- JMP
- Gephi
Summary
- ID 1278894 and ID 839736 stand out for their large volumes of communication.And they are the staff of the park.
- Crime happened at Coaster Alley around 11:30 AM on Sunday, then spread out gradually to Wet Land.
https://public.tableau.com/views/Assignment3-2_1/TimeSeriesofUser1278894?:embed=y&:display_count=yes
