ISSS608 2016-17 T1 Assign3 Lee Mei Hui Cheryl
Contents
- 1 Abstract
- 2 Data Preparation & Tools
- 3 Approach
- 4 Question 1 - Identify the IDs that stand out for their large volumes of communication
- 5 Question 2 - Describe up to 10 communication patterns in the data, prioritizing patterns related to the crime
- 6 Question 3 - Hypothesize when the vandalism was discovered
Abstract
DinoFun World, an amusement park, held an event over 3 days to pay tribute to their hometown soccer hero Scott Jones. However, the event was disrupted by a crime that occurred over the weekends. Given movement and communication data of visitors from Friday to Sunday, the aim of this assignment is to answer the following questions:
- Identify the IDs that stand out for their large volumes of communication
- Characterise the communication patterns
- Based on these patterns, form a hypothesis about these IDs
- Describe up to 10 communication patterns in the data, prioritizing patterns related to the crime.
- Hypothesize when the vandalism was discovered
Data Preparation & Tools
For this assignment, I utilized the following software:
- JMP
- Tableau
- Gephi
To utilize the various software, steps had to be taken to prepare the data in the appropriate format.
- Data was checked for any missing or inappropriate data
- It was found that Sunday’s movement data had 1 row that only had a timestamp but no other information (eg. ID, type or X and Y coordinates)
- Sunday’s movement data also contained one an extra row of heading, eg. Timestamp, id, type, X, Y that was removed.
- Gephi has limited capability in supporting large data. For instance, there can only be a maximum number of 100,000 nodes and 1,000,000 edges. The dataset provided contained approximately 9 million rows for movement data per day, and up to 1.5 million rows for communication per day. It was necessary to transform to be loaded into Gephi.
- Utilizing the summary function in JMP, the movement data was grouped by “ID” to be utilized as nodes. The resultant data showed how many times each ID was tracked by the movement sensors, and showed the total number of unique IDs that were present during the day. This resulted with an approximate 3.5k visitors on Friday, 6.4K visitors on Saturday, and 7.5K visitors on Sunday.
- Similarly, the summary function was utilized in JMP for communication data, grouping by “From” and “To” to preserve the directed communication from individual IDs. This resulted in the ability to identify how many communications were made from each source to the respective target.
Approach
Tableau Used for identifying overall trend. Communication data for 3 days was loaded to visualize the number of communications by time. This gave a good overview in identifying which time periods had abnormal communication patterns.
- Location was used as the colour marker to drill down into which locations had these abnormal patterns.
Gephi Utilized to identify communication patterns by IDs. Yifan Hu layout was utilized; network diameter and modularity was calculated to identify if there were any patterns in the data. Eventually modularity was used as the colour attribute to differentiate different groups.
JMP Used for looking at details. Patterns that were identified using Tableau and Gephi were analysed in JMP to drill down into details.
Question 1 - Identify the IDs that stand out for their large volumes of communication
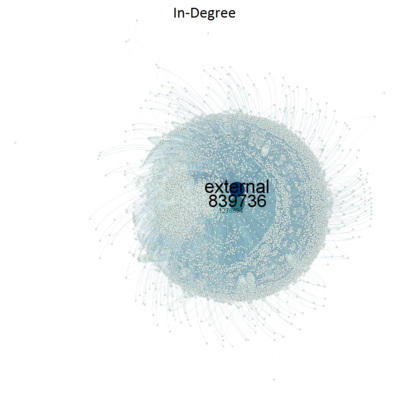
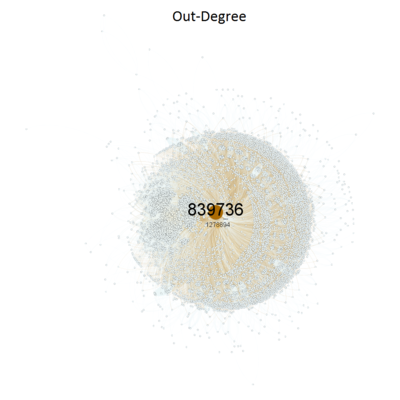
There were 3 IDs that stood out for the large volumes of communication over the 3 days as seen from the Gephi plot.
- ID 1278894
- ID 839736
- External
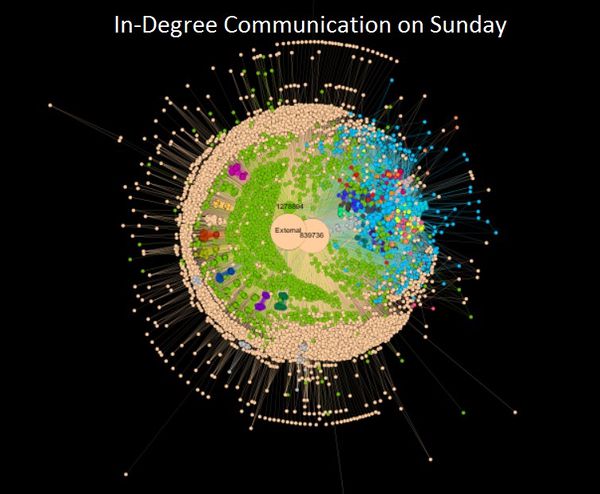
Below are 2 images from Gephi that show the In and Out degree communications across the 3 days
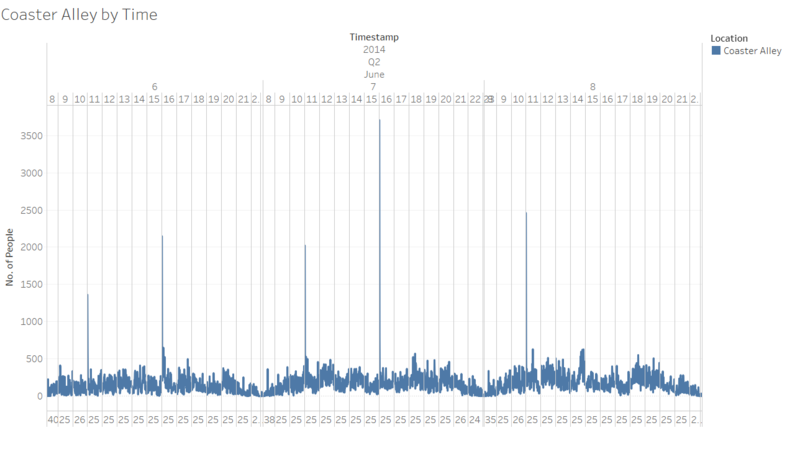
In addition, there are another 2 images below from Tableau showing more details about these 3 IDs
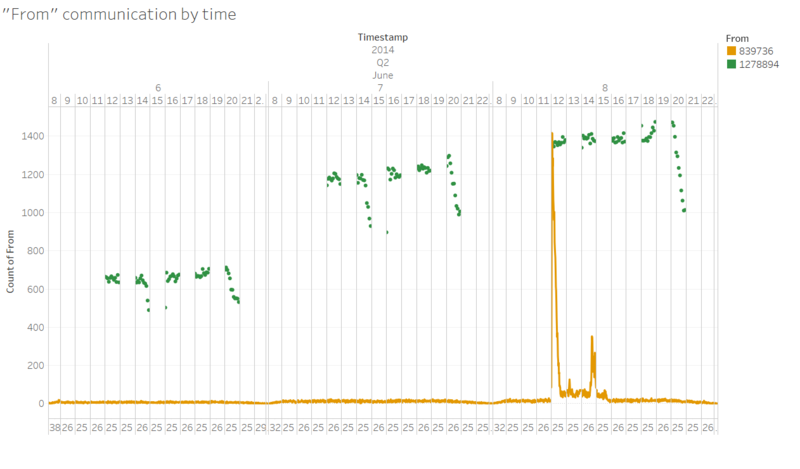
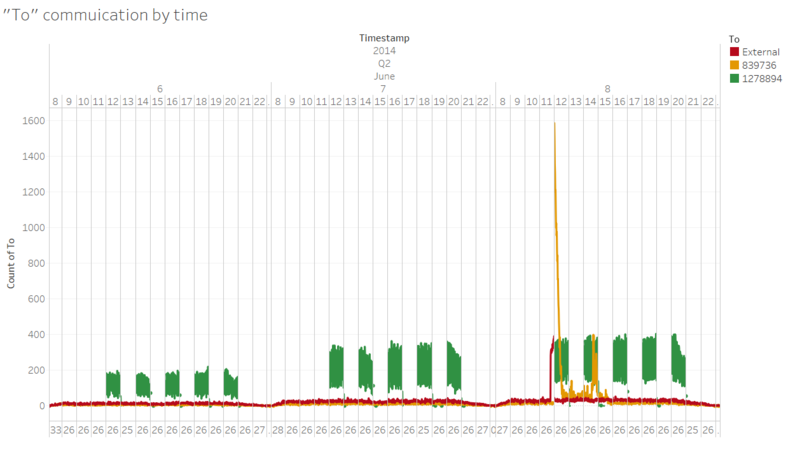
External
- Has high in-degree but no out-degree, as seen from the size of the label in the Gephi images above, and the lack of an "External" line in the "number of communication from IDs across time" image
- Represents communication from individuals in the park to external sources
- The tracker probably does not have the function to track messages sent from external sources to individuals in the park
ID 1278894
- Sent and received a significant proportion of messages
- Upon further analysis, it was noted that 1278894 only sends data from Entry Corridor, and has high communication bi-hourly (eg. 12pm, 2pm, etc.) sending out massive number of texts at 5 minute intervals only from 12pm to 8pm
- Bulk messages (Eg.600 to 1400) were sent out in one go
- 38K were sent on Friday, 70K on Saturday, and 80K on Sunday
- Upon searching movement data for this ID, it did not exist across the 3 days
Hence it can be concluded that his was a machine, and probably the game app that the themepark has, that sends out messages to individuals play the game, and allows them to respond to win certain prizes.
ID 839736
- This ID had the largest proportion of in and out communications when observing the combined 3 days’ worth of data
- When looking at communication patterns at the individual level, all messages were first sent from another ID to 839736, and within a couple of minutes, a response will be sent back to that ID
- Apart from the abnormal pattern during Sunday at 12pm, almost all messages that were sent to this ID was responded to
- Upon searching movement data for this ID, it did not exist across the 3 days as well
Hence, a likely conclusion is that this is the themepark's information desk, since people might have questions (eg. about showtimes etc.) that they require answers to.
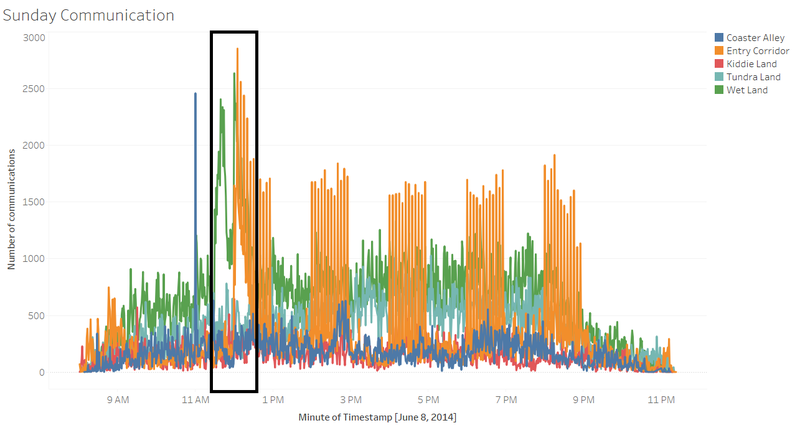
1) Over the 3 days, there was always a communication spike at 11pm and 4pm respectively at Coaster Alley, except for Sunday, where the spike was only observable at 11pm
- It was further observed that the spike always occurred at attraction 63, which is the stage
- Perhaps one possible reason is that Scott Jones was holding some sort of event at this point (refer to point 5 below for deduction)
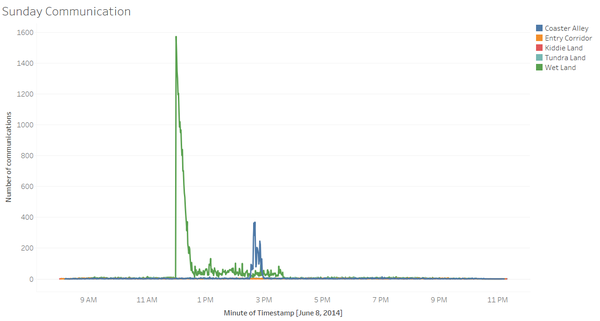
2) Abnormal communication was seen on Sunday from 11.30 – 12.30 in the Wetlands, and subsequently another spike in communication from 12 – 12.30 at the entry corridor, as seen from the black box in the image below.
- This was attributable to the crime (refer to question 3 for more details)
3) For visitors that came for 3 days
- Most of them, approximately 2/3 (~1000 out of 1532), kept communicating to the same few people
- The remaining 1/3 had communication with various people across the 3 days, suggesting they made friends along the way
- This shows that although people may visit for more than 1 day, it doesnt mean that all will make new friends along the way
4) Types of visitors on a given day, in this case, Sunday:
- The large proportion of beige group shows that individuals that communicate to a few people, from 3 – 10 people, including the game application (ID 1278894) and information desk (ID 839736)
- The green proportion generally talk to 1-5 other people, that includes external communication
- There are very distinct, large, groups that communicate mainly amongst themselves, as seen from the multi-coloured groups (on the left, in between the beige and green cluster)
- The large cluster (that's mainly blue) indicates people who have associate with many other people in the park, generally the more out-going people
5) 521750, 644885, 1080969, 1600469, 1629516, 1781070, 1787551, 1935406, had no check-ins for rides across 3 days, and consistently took the same path (as seen from the general movement pattern image)
- Zero communication amongst this group in the entire day cross 3 days
- Sunday had the least number of walks, same pattern, but left by 12 pm
- Were present at stage 63 during the communication spikes at 11am and 4pm on all days
Hence, likely to be bodyguards or assistants of Scott Jones.
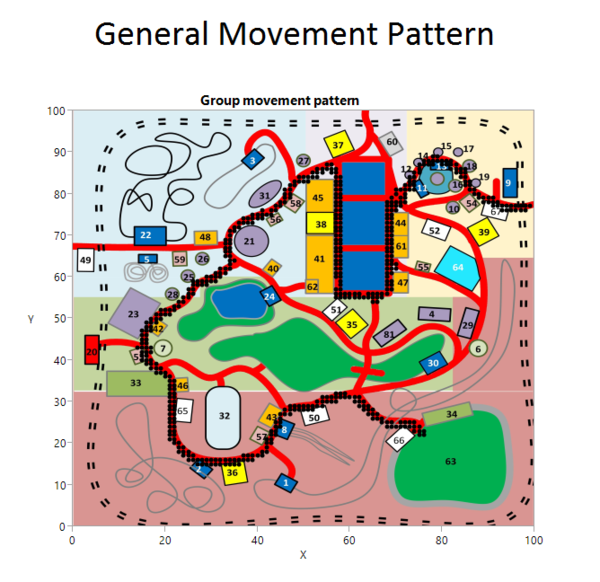

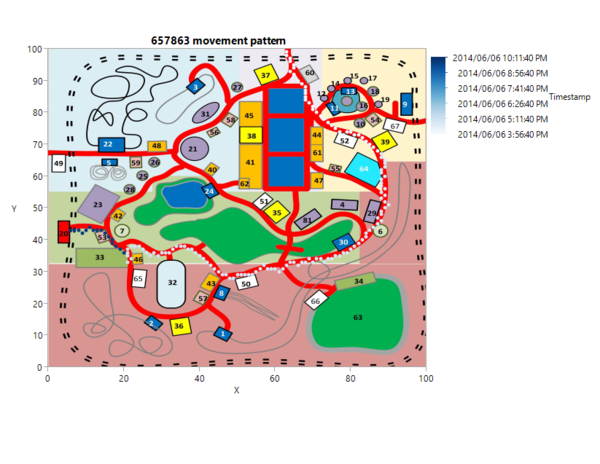
6) 657863 was had unusual communication and check in data
- He was the only individual that did not have a check-in. All other individuals across the 3 days had check-ins at the entrance or at rides
- He was present on both Friday and Saturday, but only checked-in on Friday
- He appeared on Friday and Saturday, where he entered at 4pm on Friday, but didn’t leave the park at 9pm according to movement data (though his last recorded point was around 9pm+), as shown from the image below
- In terms of communication, he only communicated on Friday to 839736 once, 14122335 (replied), 103006,1937834,313073 (replied). There was no communication from him or his buddies on Saturday
One likely conclusion is this could have been an individual who lost his device on Friday, and Saturday's movement data was due to a park personnel/individual who found and returned the device.
Question 3 - Hypothesize when the vandalism was discovered
Vandalism was likely reported on Sunday from 11.30 to 11.45am, where there was suddenly a huge influx of questions to External from Wetlands, possibly sharing photos online of the crime, or making phone calls to the police
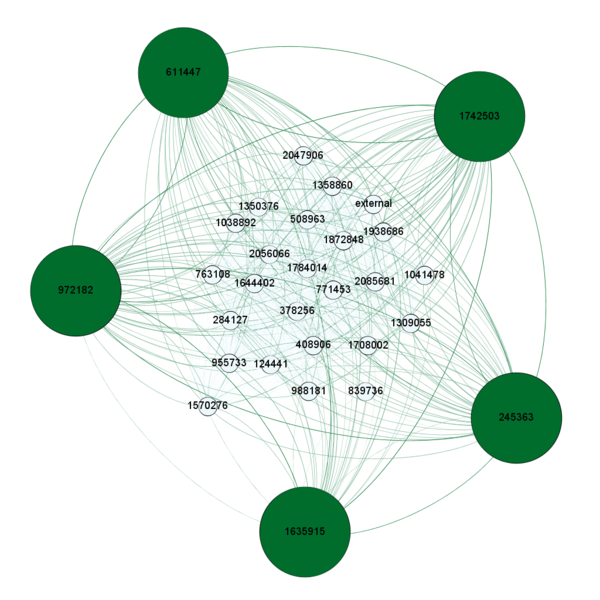
Based on tracking of communication during 11.30 - 11.45am, Group containing 1742503 and friends, who had the same movement data was at pavilion from 9.30AM onward. Their mass started texting at 11.30am, and were likely the first group to notify the information desk (ID 839736). Below you can see the whole group of individuals who were likely avid Scott Jones fans who first discovered the crime.
At 12pm, there was a surge of contact to the information desk (ID 839736), as shown below, probably asking questions or clarifying issues. For instance, there could have been an announcement made at around 12 to inform park-goers that the Scott Jones show for the afternoon would be cancelled. Similarly, the smaller spike at around 3pm were probably by individuals who missed the announcement and were wondering why Scott Jones was not around.
