ISSS608 2016-17 T1 Assign3 Kuar Kah Ling
Contents
Overview
DinoFun World is a typical modest-sized amusement park, sitting on about 215 hectares and hosting thousands of visitors each day. It has a small town feel, but it is well known for its exciting rides and events.
One event last year was a weekend tribute to Scott Jones, internationally renowned football (“soccer,” in US terminology) star. Scott Jones is from a town nearby DinoFun World. He was a classic hometown hero, with thousands of fans who cheered his success as if he were a beloved family member. To celebrate his years of stardom in international play, DinoFun World declared “Scott Jones Weekend”, where Scott was scheduled to appear in two stage shows each on Friday, Saturday, and Sunday to talk about his life and career. In addition, a show of memorabilia related to his illustrious career would be displayed in the park’s Pavilion. However, the event did not go as planned. Scott’s weekend was marred by crime and mayhem perpetrated by a poor, misguided and disgruntled figure from Scott’s past.
While the crimes were rapidly solved, park officials and law enforcement figures are interested in understanding just what happened during that weekend to better prepare themselves for future events. They are interested in understanding how people move and communicate in the park, as well as how patterns changes and evolve over time, and what can be understood about motivations for changing patterns.
The Tasks
Using the in-app communication data over the three days of the Scott Jones celebration, visual analytics is applied to solve the following questions:
- Identify those IDs that stand out for their large volumes of communication. For each of these IDs
- Characterize the communication patterns you see.
- Based on these patterns, what do you hypothesize about these IDs? Note: Please limit your response to no more than 4 images and 300 words.
- Describe up to 10 communications patterns in the data. Characterize who is communicating, with whom, when and where. If you have more than 10 patterns to report, please prioritize those patterns that are most likely to relate to the crime. Note: Please limit your response to no more than 10 images and 1000 words.
- From this data, can you hypothesize when the vandalism was discovered? Describe your rationale. Note: Please limit your response to no more than 3 images and 300 words.
Data
Park movement and communication data over three days of the Scott Jones celebration were provided. Additionally, the DinoFun World Park map and webpages were available for reference.
The park movement data had 26,021,962 rows and included the following fields:
- Timestamp: Date and time of the movement activity
- ID: ID of park-goer
- Type: Check-in or movement, where a check-in means the park-goer joined in the attraction queue and movement means general movement within the park.
- X: X-coordinate of where the movement type was recorded.
- Y: Y-coordinate of where the movement type was recorded.
The communication data had 4,153,329 rows and included the following fields:
- Timestamp: Date and time of message when sent, in the format yyyy/MM/dd hh:mm:ss AM/PM
- From: ID of park-goer who sent out the message
- To: ID of park-goer who received the message
- Location: Areas within the DinoFun World Park.
Data Preparation & Exploration
We will mainly be using the communication data to answer the questions.
- The communication data for the 3 days are combined in JMP using ‘Concatenate’ function.
- Recode ‘external’ to ‘0’ under column ‘To’.
- Rename ‘From’ and ‘To’ to ‘Source’ and ‘Target’ respectively.
- Change modelling type of ‘From’ and ‘To’ from continuous to nominal.
- Reorder columns to be ‘From’, ‘To’, ‘Location’, ‘Timestamp’. This resulting table will be used as for creating the ‘Edge’ table for subsequent network visualisation.
- Using the table above, a ‘Nodes’ table is created by copying the ‘From’ column to a new data table and renaming the new ‘From’ column to ‘ID’.
- Export both data tables and save the files in CSV format.
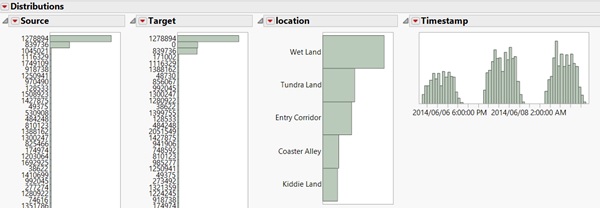
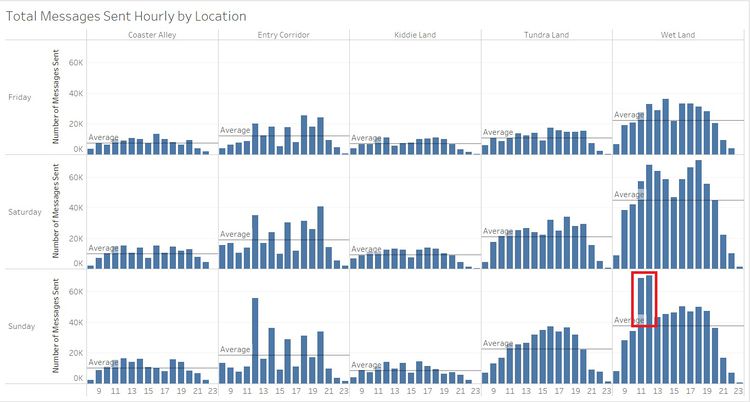
Using JMP’s ‘Distribution’ function, we could identify 2 IDs with high volumes communication i.e. ID 839736 and ID 1278994. It is also shown that many park-goers communicate to external contacts, which is denoted as ID number ‘0’. Majority of the communication came from Wet Land and the communication pattern over the first 2 days (Friday and Saturday) are similar. The 11am-12pm hour on Sunday had a sudden spike in communication which could be related to the crime committed in the park.
Task 1
Using Tableau, we can zoom into the communication patterns of ID 839736 and ID 1278994.
ID 839736 - DinoFun's alert/help service ID
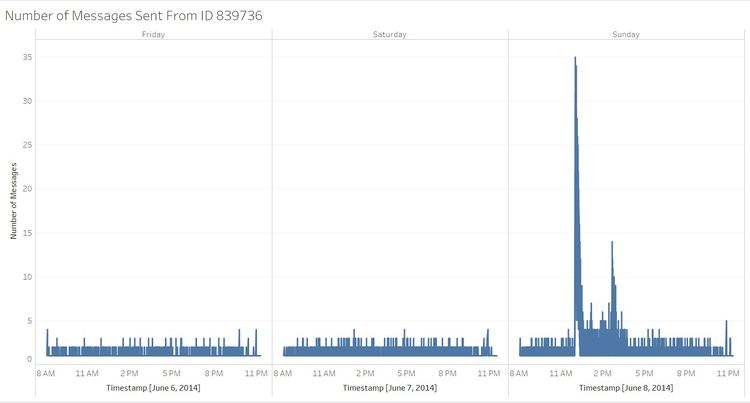
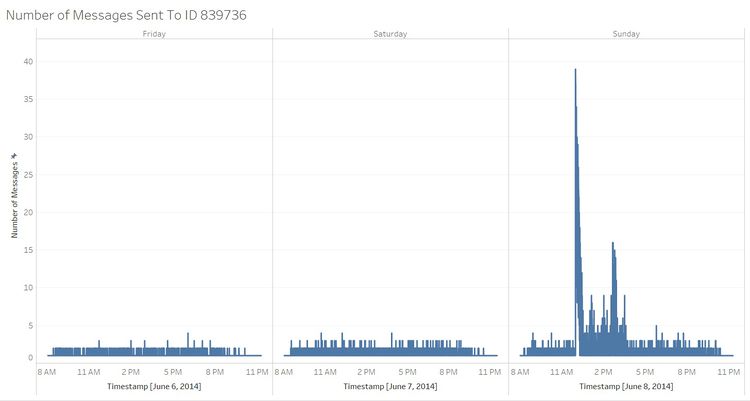
Communication starts around 8am and ends around 11.30pm daily. Number of messages from ID839736 on Jun 6 and 7 ranges from 1 to 4 messages. However, on Jun 8, it ranged from 1 to 35, with its peak at 12.03pm. Number of messages to ID839736 on Jun 6 and 7 ranges from 1 to 4 messages. However, on Jun 8, it ranged from 1 to 39, with its peak at 12.00pm. The low number of communications, plus its long, regular hours, suggests that this ID is DinoFun's alert/help service ID.
ID 1278894 - Cindysaurus Trivia Game
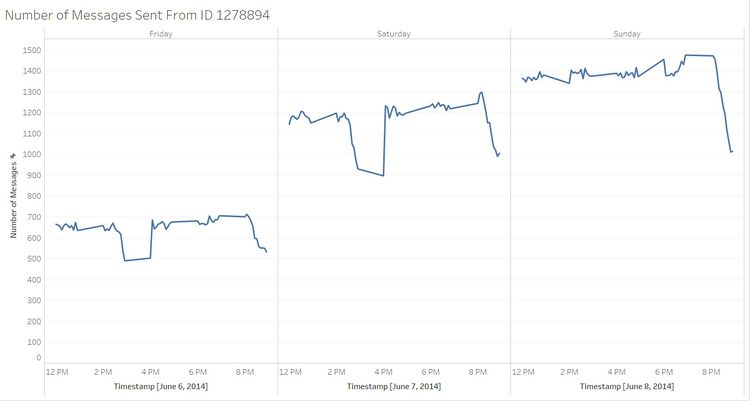
Communication from ID 1278894 starts from 12noon to 8.55pm daily, over the 3 days. The communication pattern is very regular, with messages disseminated every 5-minute interval between 2 noon to 12.55pm, 2 to 2.55pm, 4 to 4.55pm, 6 to 6.55pm and 8 to 8.55pm. On 6 and 7 Jun, there is always a huge dip in the number of messages sent from this ID between 2.40pm to 2.55pm and then a jump in number of messengers between 4 to 4.05pm. Number of messages on Jun 6 ranged from 490 to 713, Jun 7 ranged from 897 to 1298, Jun 8 ranged from 1011 to 1475. Communication to ID1278894 is similar in terms of its timing. There are 5 distinct periods of communication – approximately 12 to 1pm, 2 to 3pm, 4 to 5pm, 6 to 7pm and 8 to 9pm. Number of messages ranged from 1 to 42 (Jun 6), 1 to 84 (Jun 7) and 1 to 48 (Jun 9). The distinct increase in messages to ID 1278894 on 6 and 7 June is observed between the 3 and 4pm hour. This could be DinoFun's Cindysaurus Trivia Game ID as it sends out questions to visitors on a 5-minute interval basis and only those who are interested would reply, and this explains the low response ratio.
Task 2
Observation 1: Location of Cindysaurus Trivia Game
Based on the graph below, Entry Corridor has regular spikes at 12pm, 2pm, 4pm, 6pm and 8pm which coincides with the timing at which ID 1278894: Cindysaurus Trivia Game sends out messages. Thus, we can infer that the park operations is located at Entry Corridor, where communications are disseminated.
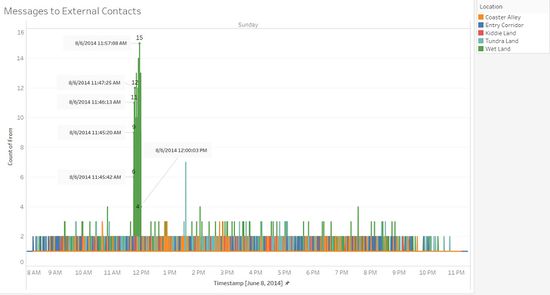
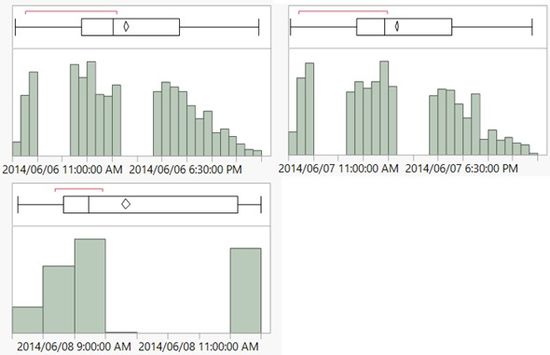
Additionally, based on the graphs, there is a spike in communications among park-goers from 11am to 1pm (above) and to external contacts beginning around 11.45am on 8 June at Wet Land (below left), which is where Creighton Pavilion’s entrance is located. Furthermore, Creighton Pavilion re-opens for visiting at 11.30am based on Friday, Saturday and Sunday's check-in data (below right). Thus, I decided to focus on the communication pattern of visitors at Creighton Pavilion from 11.30am to 12.10pm on 8 June.
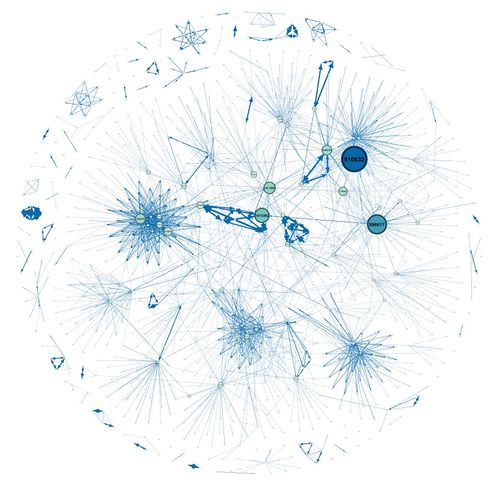
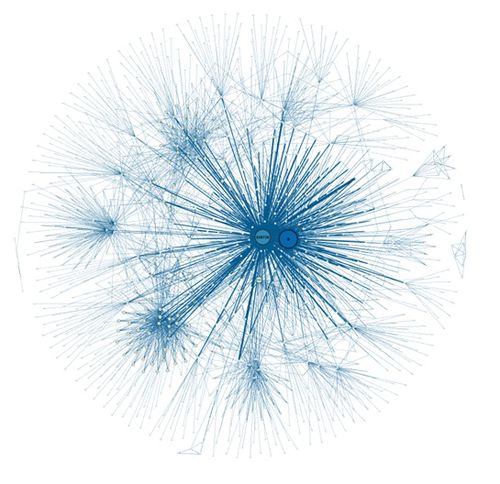
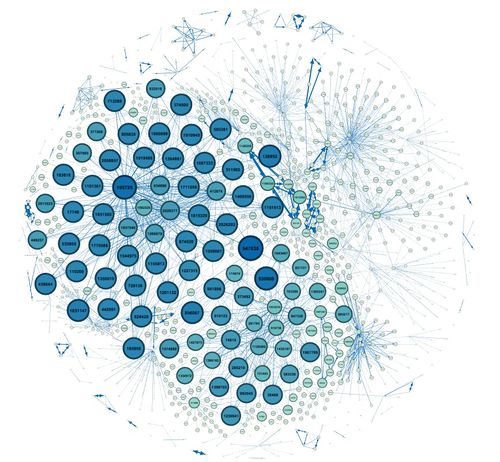
After joining the data of check-in and communication to create a data table for communication of visitors at Creighton Pavilion from 11.30am to 12.10pm on 8 June, the resulting data is imported into Gephi to create a network graph. The network graph contained a total of 1091 nodes and 2941 edges. Research and exploration of the various layouts was done [1] and the Fruchterman Reingold layout was eventually chosen due to its ease of interpretation and readability. Noverlap was run to prevent nodes from overlapping. Node size and node colour were used to reflect the metric that is being analysed.
Based on the following network metrics, observations were noted.
- Out-Degree: The number of ties that the node directs to others, interpreted as a form of sociability.
- In-Degree: The count of the number of ties directed to the node, interpreted as a form of popularity.
- Betweenness Centrality: This measures the likelihood that a node is involved in a direct route between two other nodes.
- Closeness Centrality: This measure how fast can a node reach everyone in the network.
- Eigenvector Centrality: This measures how well is this node connected to other well-connected nodes.
Observation 2: Out-Degree
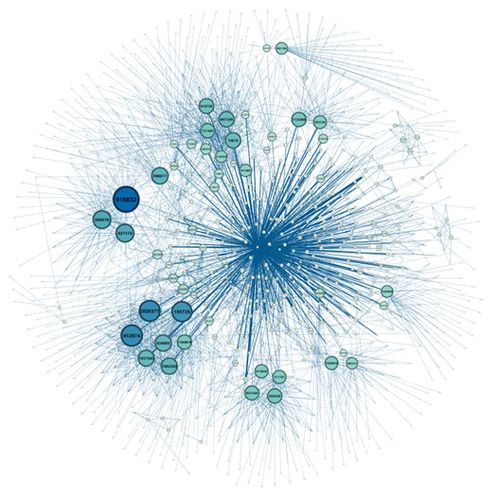
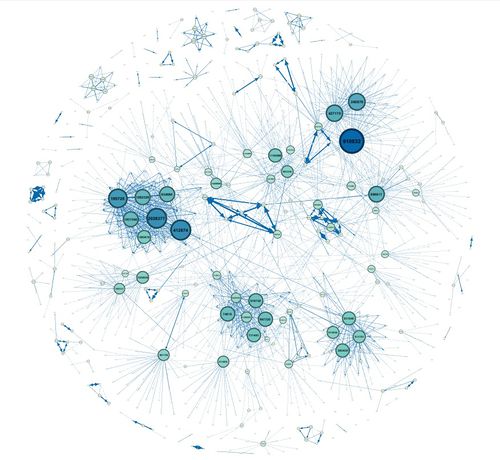
ID 910832 has the highest out-degree (below left). Using the interactive graph (by exporting to sigma.js), we can see that ID 910832 has 80 outgoing communications and 6 mutual communications. Another ID with high out-degree is ID 2028377 (63 outgoing and 6 mutual communications). They could be leaders of their group thus, they are in-charge of mass-sending information to their group members. When IDs 839736, 1278894 and external contacts were excluded (below right), ID 910832 remained as the person with highest out-degree. Around 25 IDs were identified to be more 'sociable' than other park-goers.
Observation 3: In-Degree
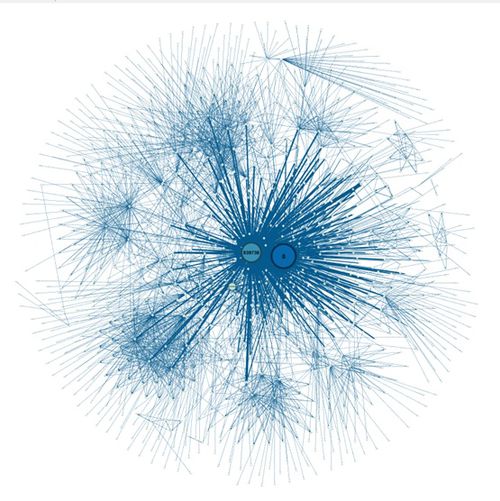
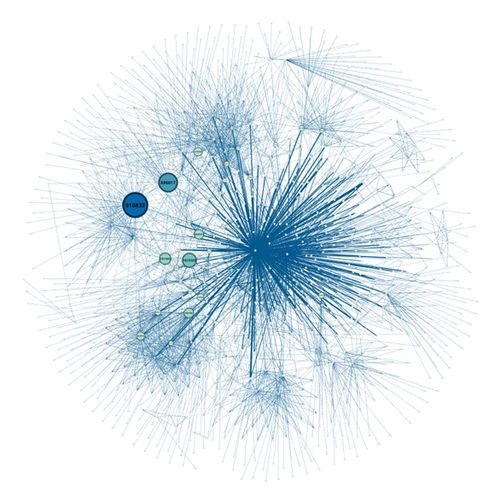
IDs 839736 and 0 (i.e. external contacts) had the highest in-degree (below left). Between these 2 IDs, external contact had a higher in-degree than ID 839736 which shows that visitors are more interested in informing their friends than the relevant authorities. Perhaps they were thinking that others have informed the park authorities already hence, not everyone acted. Another possibility is that each group had one representative member to contact the park authorities while the rest, including the representative member, informed their external contacts.
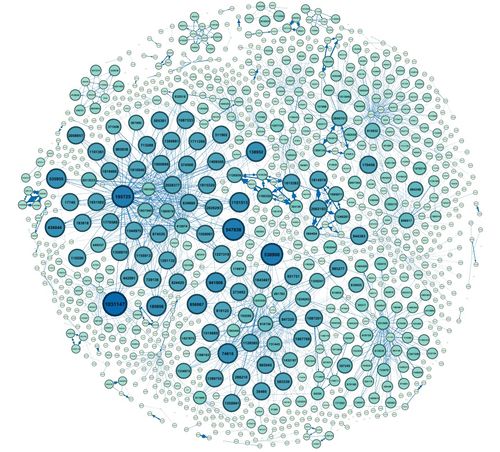
Excluding IDs 839736, 1278894 and external contacts, ID 1031147, 530908, 547838, 195725 are among those with the highest in-degree (below right). ID 1031147 has 10 incoming contacts with no outgoing or mutual contacts. IDs 530908 and 547838 are similar in their communication, with 9 incoming and no outgoing or mutual contacts. ID 195725 is the only one among these 4 contacts to have outgoing contacts (54) with its 9 incoming contacts. If IDs 1031147, 530908, 547838 were travelling with their friends, it is interesting that they do not reciprocate the messages. In any case, we know that they are not forgotten by their group.
Observation 4: Betweenness Centrality
ID 910832 stood out for its high betweenness centrality (below left). As mentioned under observation 1, ID 910832 has the highest out-degree and now, he/she is also the most direct route between 2 people in this data set. There is minimal difference in the network graph, resulting from the exclusion of IDs 839736, 1278894 and external contacts (below right).
Observation 5: Closeness Centrality
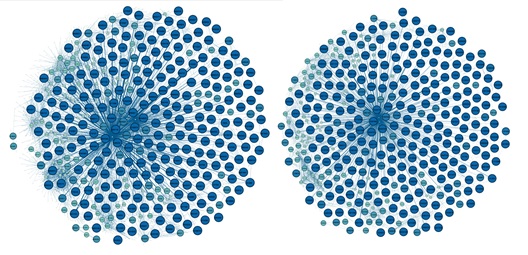
When it comes to Closeness Centrality (below left), many IDs have similar node size and all of them congregate around ID 839736 and 0. Other than that, it does not provide distinctive information. As Closeness Centrality’s values tend to span a rather small dynamic range from smallest to largest, it is difficult to distinguish between central and less central vertices using this measure. Additionally, even small fluctuations in the structure of the network can change the order of the values substantially. Thus, Harmonic Closeness Centrality (below right) is used instead as it redefines closeness centrality in terms of the average of the inverse distances between vertices. [2]
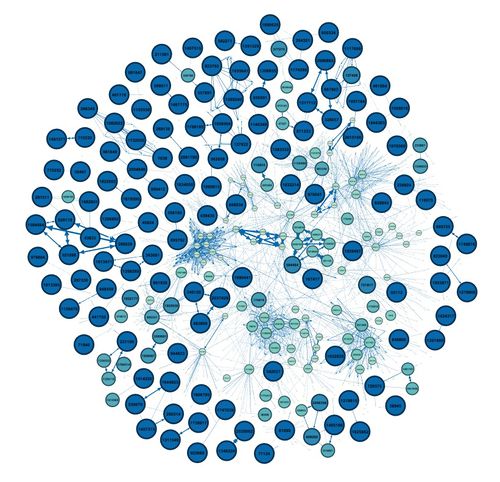
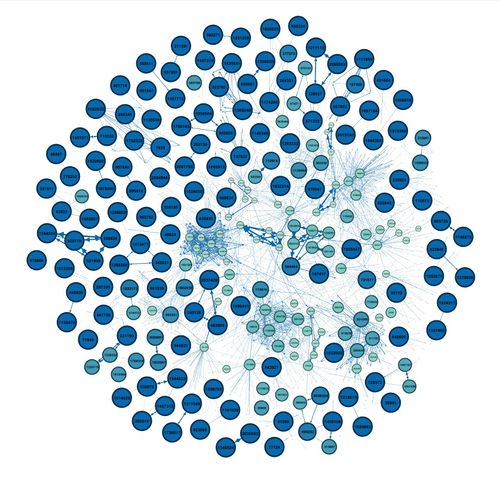
Similar to the other network metrics, a network visualisation excluding external contacts, IDs 839736 and 1278894 was created. The graph on the bottom left is based on Closeness Centrality while the one on the bottom right is based on Harmonic Closeness Centrality. Without IDs 839736 and 0, there is no area of congregation for the nodes. Additionally, there is no visible difference between the Closeness Centrality and Harmonic Closeness Centrality.
Observation 6: Eigenvector Centrality
The external contact (i.e. ID 0) is the most well-connected, followed by ID 839736 (below left). Combining with observation 2 (in-degree), we can conclude that ID 839736 and 0 are the most popular and well-connected IDs. This goes to show how much people loves spreading news at the very first instance. However, once IDs 839736, 1278894 and external contacts are removed, a very different graph is presented (below right). ID 547838 is now the most well-connected person, with 9 incoming contacts (IDs 1559001, 1580679, 1882328, 1937540, 2028377, 195725, 346310, 412874, 634880). What is interesting is that ID 547838 has these 9 incoming contacts only and does not have any outgoing or mutual contacts. Its Betweeness Centrality, Harmonic Closeness Centrality, Eccentricity, Closeness Centrality are all rated '0.0' while its Eigenvector Centrality is rated '1.0'.
Observation 7: Regular Peaks in Daily Communication Data
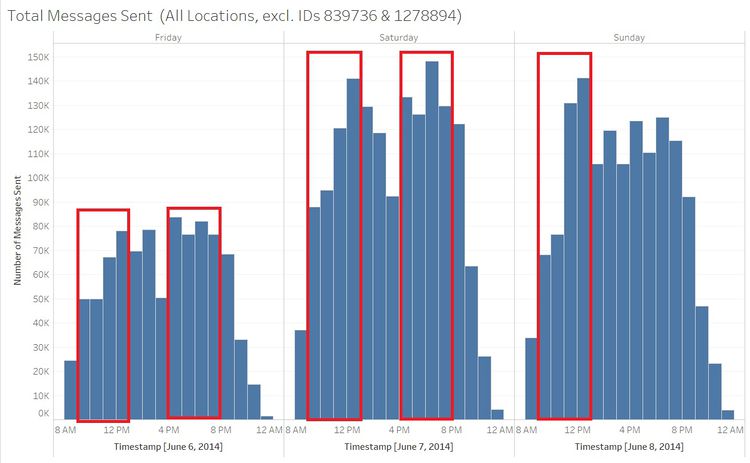
It is observed that total messages sent on Friday and Saturday have similar patterns. There is an increase in messages sent from the 8-9am hour, which continues to rise till 12pm before dropping. Then, the next spike happens at the 3-4pm hour which remains quite consistent before dropping again in the 7pm hour. This spike in communication could be due to visitors catching a glimpse of Scott Jones while in the park or when they attend the twice daily Amazing Scott Soccer Showcase Show, and were sharing their excitement with other parties (within and outside of DinoFun). The similar pattern could be observed in the first half of Sunday, i.e. the increase in communications from 9am to 12pm.
Task 3
Since Creighton Pavilion (where Scott Jones’ trophies are showcased) is at the Wet Land area, based on the previous 2 observations, it is likely that the vandalism took place at Creighton Pavilion. Further, Creighton Pavilion’s check-in patterns showed that there were no more check-ins after 12pm on Sunday, suggesting that the location was closed for investigation.
Based on the messages sent to external contacts and messages to ID 839736 (earlier identified as Park Helpline), the vandalism was probably first discovered on 8 June, around 11.45am at the Creighton Pavilion (Wet Land area).
Software Used
JMP Pro 12: For data preparation and high-level review of data
Tableau: For detailed review of data and creating visualisations
Gephi: For creating network visualisations
