ISSS608 2016-17 T1 Assign3 Chris Thng Ren Jing Results
|
|
|
|
Results
Contents
- 1 Identify those IDs that stand out for their large volumes of communication. For each of these IDs characterize the communication patterns you see.
- 2 Based on these patterns, what do you hypothesize about these IDs? Note: Please limit your response to no more than 4 images and 300 words.
- 3 Describe up to 10 communications patterns in the data. Characterize who is communicating, with whom, when and where. If you have more than 10 patterns to report, please prioritize those patterns that are most likely to relate to the crime. Note: Please limit your response to no more than 10 images and 1000 words.
- 3.1 Analyzing communication patterns which stand out
- 3.2 Let us take a step back, and analyze if there could be any relationship to the Scott Jone's Exhibition at Creighton Pavilion
- 3.3 Pattern 3: Spotting the "mutes" with similar movement data
- 3.4 Pattern 4: What could this group of 7 be doing?
- 3.5 Pattern 5: Identifying communication patterns in relation to this Group of 7's odd behavior
- 3.6 Pattern 6: Identifying and characterizing different groups of tourists based on the communication
- 4 From this data, can you hypothesize when the vandalism was discovered? Describe your rationale.
Identify those IDs that stand out for their large volumes of communication. For each of these IDs characterize the communication patterns you see.
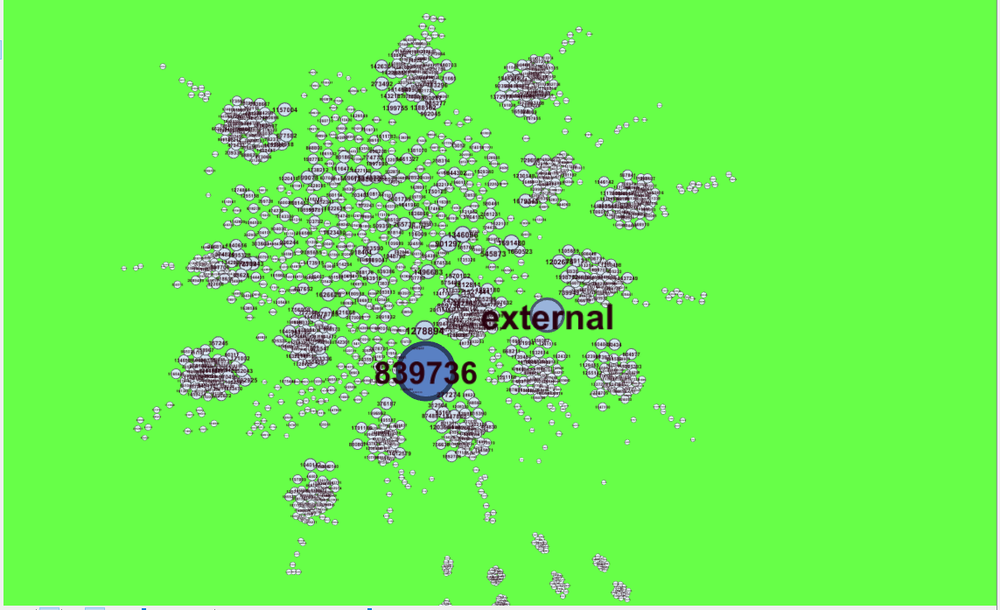
Using Gephi, I was able to present the 3 days communication data in the image below. It illustrates the degree of communication patterns for the 3 days in Dinopark. The size of the nodes vary as the degree of communication increases. I will explore the various communication patterns and provide visualizations to support my analysis in this report.
Most notable IDs that stood out for large volumes of communication over the 3 days of communication data collected in Dinopark: 839736, external, 127889
Focusing on the largest Node: Communication Pattern for ID 839736:
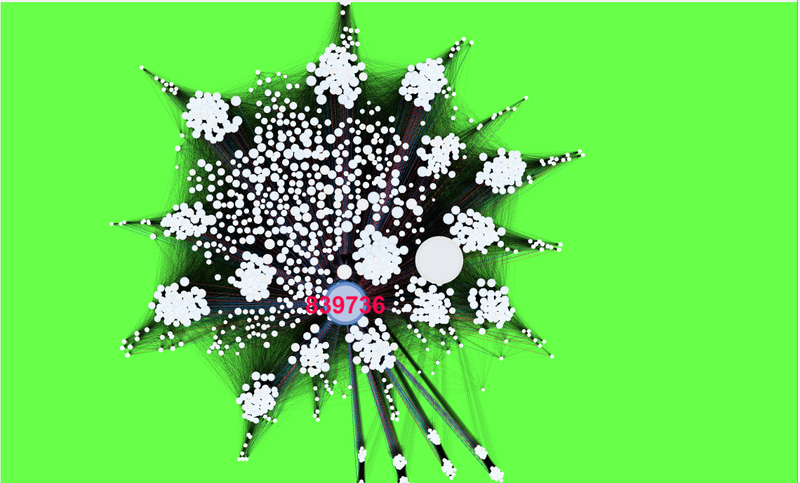
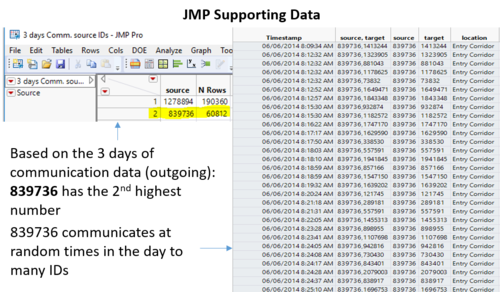
ID 839736 seems to be communicating with a lot of the visitors in Dinopark. It sends and receives messages at all times of the day. However, it is only communicating from the location of the Entry Corridor. It seems to be stationed at the Entry Corridor, appears in all 3 days, sends over 60,000 messages in the 3 days and lastly all its messages seemed to be a 1:1 send/receive.
Focusing on the second largest Node: Communication Pattern for ID 1278894:
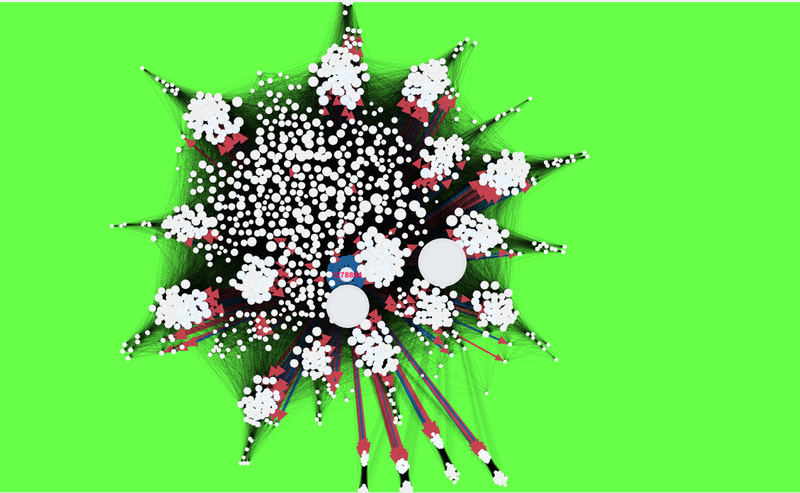
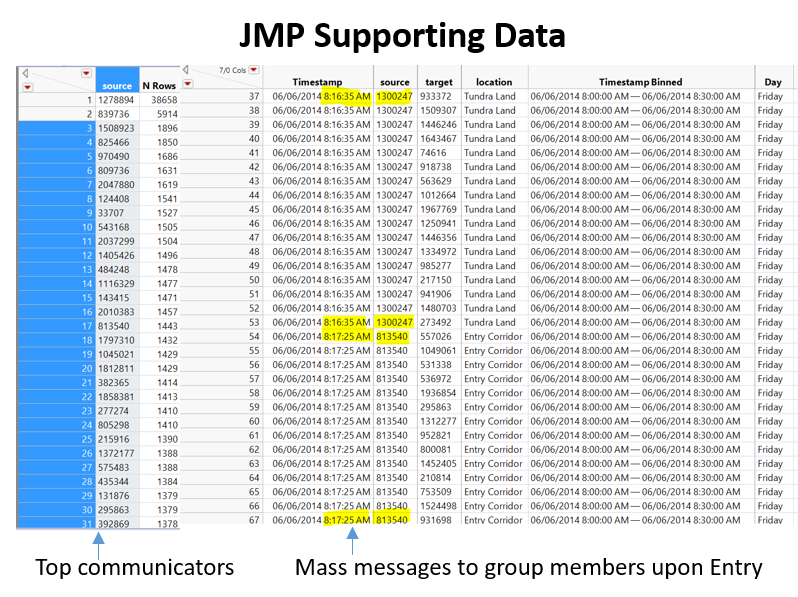
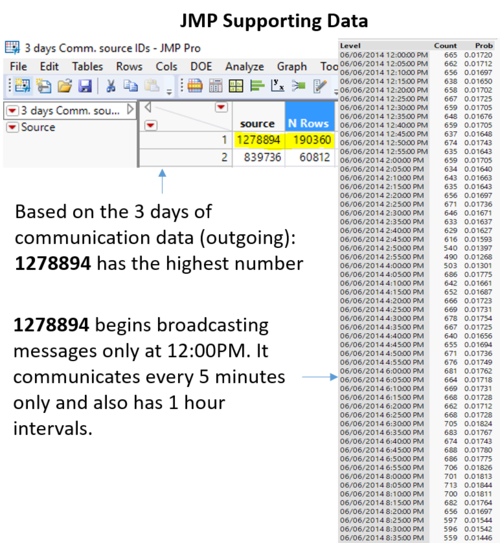
ID 1278894 seems to be a message broadcast system. Sends messages only in the time frame from 12pm to 8:55pm. Does so every 5 minutes, every alternate hour. Based on the data it works in this manner, 12:00PM – 12:55PM, 2:00PM – 2:55PM and so forth. It does not send to all visitors, only some. It seems to be a question & response type of communication. Each time there is a communication made to the visitors ID, a response or no response will be made by the visitor (more outgoing messages than incoming).
Focusing on the third largest Node: Communication Pattern for ID external:
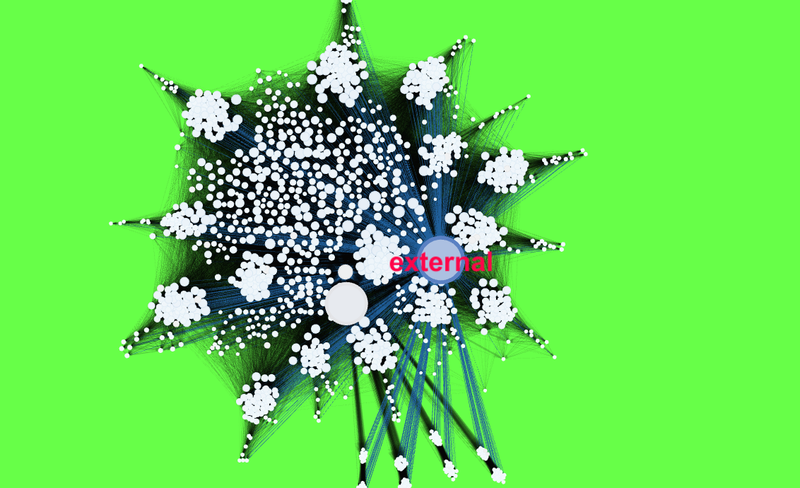
This ID seems to be just receiving messages from the IDs within Dinopark.
Based on these patterns, what do you hypothesize about these IDs? Note: Please limit your response to no more than 4 images and 300 words.
1278894 is likely to be the Trivia Game application giving “hours of fun”. I can hypothesize that this Trivia Quiz application is not a mandatory application of use by visitors. They have the option to take part in this game. Every 5 minutes a new question / quiz will be communicated to the visitors who are taking part in the Trivia Game. The visitors (participants) who are taking part in it will receive the question and has the option to either respond or ignore. I used a validation formula to ensure this was the case, it is always questions (to) more than or equals to answers (from) not the opposite; more responses than questions. Additionally, 1278894 does not communicate with any external devices. Hence, I believe this ID represents the Park’s Trivia Game – Cindysaurus. It has a maximum of 60 questions and same goes for the responses.
839736 could possibly be manned by Dinopark employees who are feeding information to the visitors from their stationed booth (there are two information booths located in the Entry Corridor). It is unlikely to be an automated service welcoming visitors as over the 3 days not all visitors are communicated with, it communicates at all times, multiple times, to multiple locations not just the Entry-Exit areas and has a large volume of communication.
External is an ID which one deduce from both the name and communication pattern (only receiving messages) that the ID: external are unregistered IDs which Dinopark visitors are communicating with. In summary, they are just external people such as friends, families who are not within the park boundaries/have not registered their phone with Dinopark’s application.
Describe up to 10 communications patterns in the data. Characterize who is communicating, with whom, when and where. If you have more than 10 patterns to report, please prioritize those patterns that are most likely to relate to the crime. Note: Please limit your response to no more than 10 images and 1000 words.
Analyzing communication patterns which stand out
Pattern 1: External Communication: Spotting the odd one out
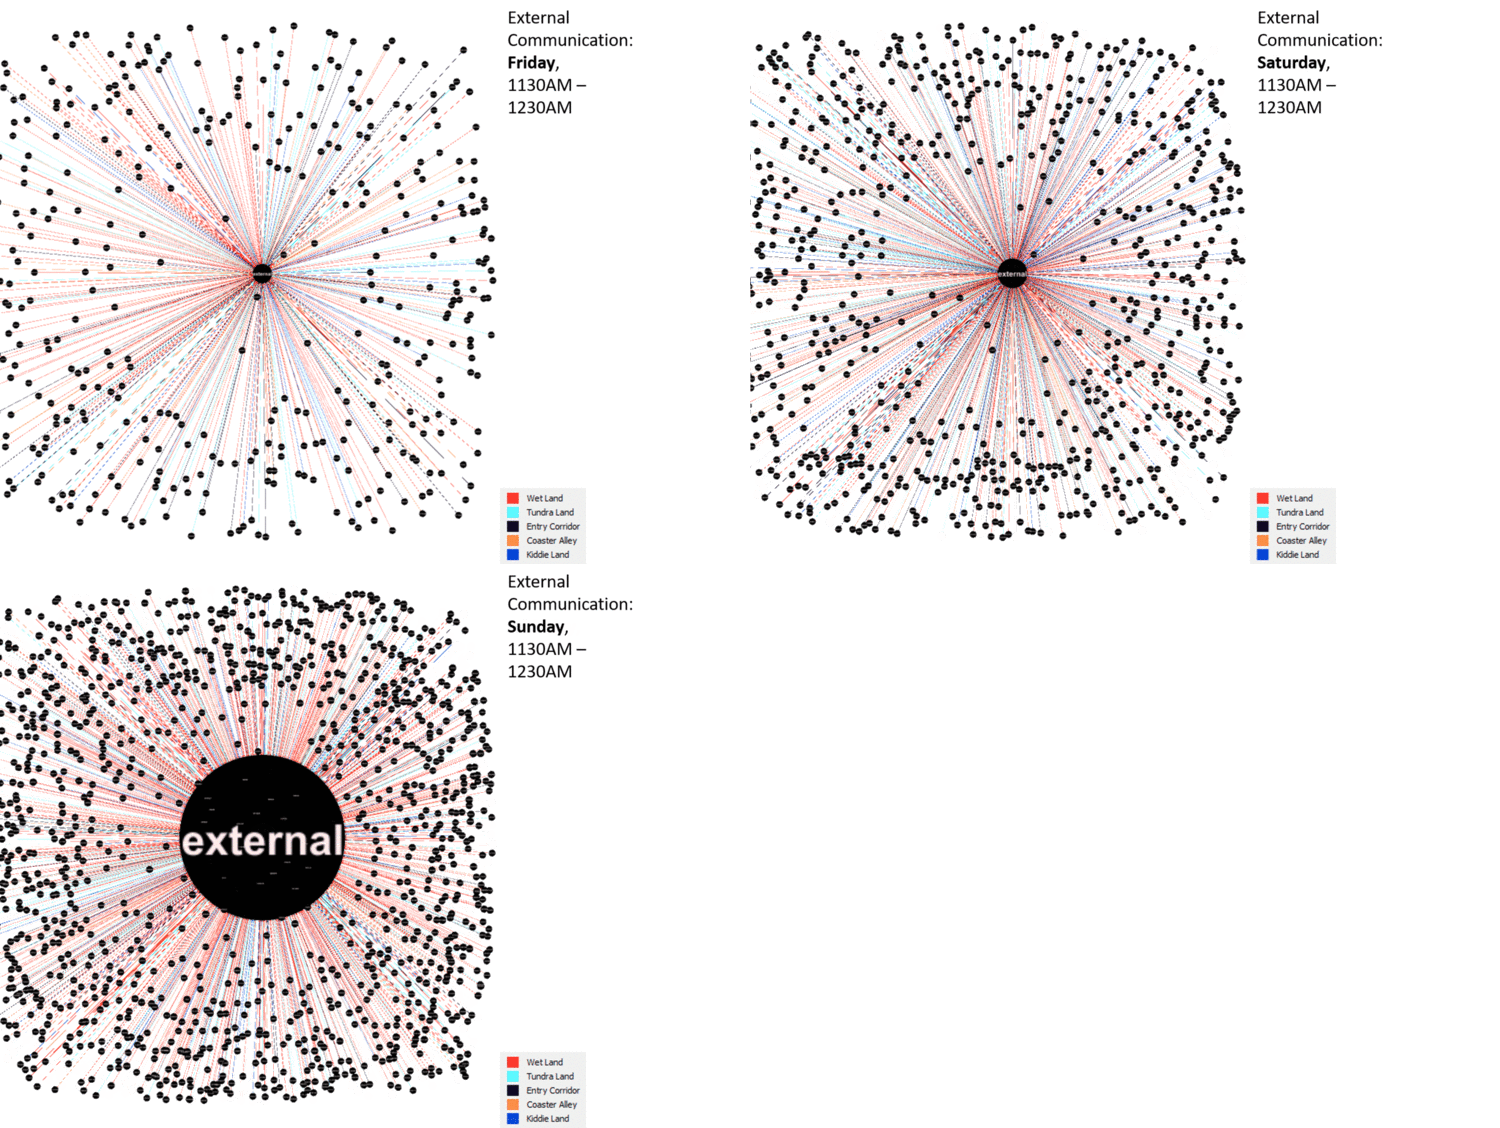
Based on the patterns first noticed in part 1 (identifying the largest communication patterns), I decided to explore deeper into the communication dataset to see if anything stood out. With assistance from JMP and Tableau, I loaded the 3 days communication data into Gephi and noticed that during the time period of 1130AM to 1200PM there was a huge spike in communication to External parties on the last day of the dataset, Sunday.
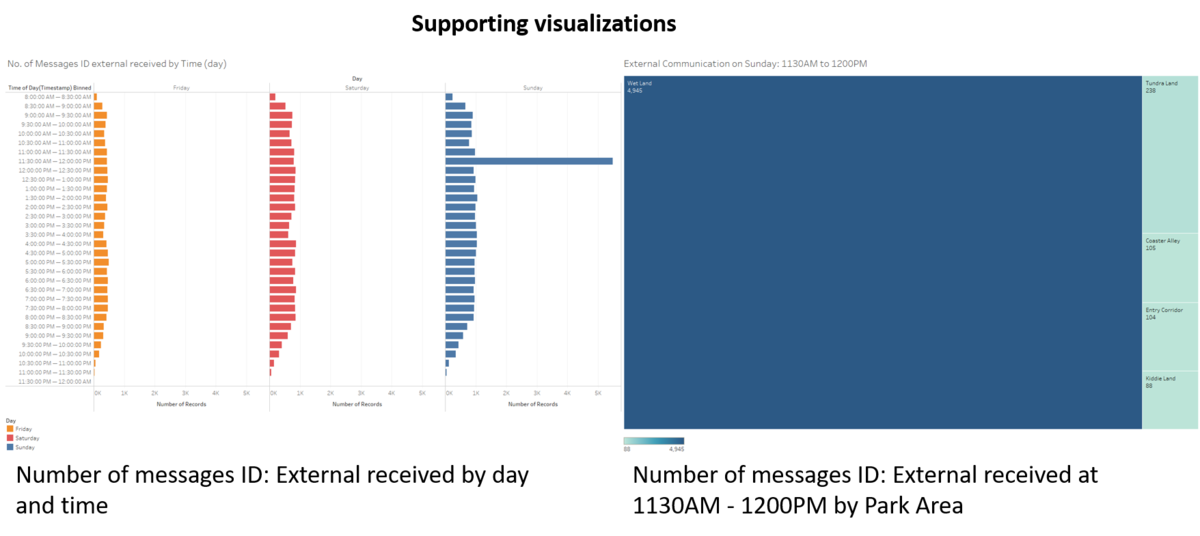
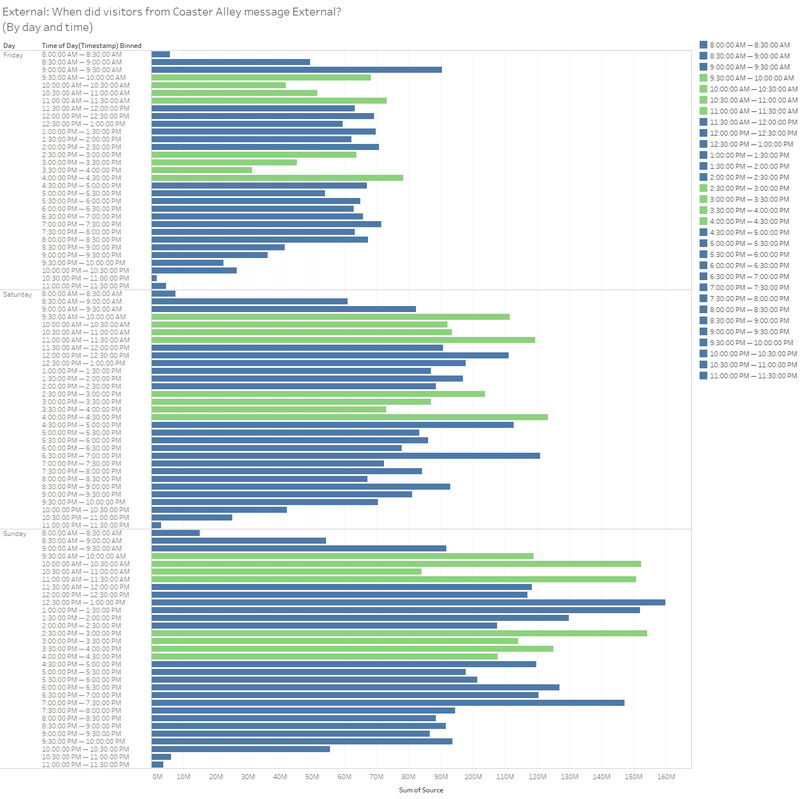
A pattern can be observed; on average people, usually message a few hundred messages to external parties within a half an hour period. However, on Sunday we can see a spike by over 500%. 5480 messages were recorded from 1130AM to 1200PM. From the illustration it can be seen that majority of the external communication was made in the Wet Lands. However, Wetlands makes up only up to 25% of the Dinopark, why would so many people be messaging there and at such a large quantity of messages too? Could this be due to something related to the highlight of the weekend? “Scott Jones memorabilia displayed at the Creighton Pavilion for the public” Coincidentally, Creighton Pavilion resides in Wetlands too. This pattern had not repeated itself on Friday or Saturday, except Sunday. I will keep this pattern in mind as we further the investigation.
Pattern 2: 839736 Communication: Spotting the odd out
Next up, I will continue with analyzing the huge communication IDs. However, this round I will focus on Sunday as I had spotted an abnormality in the shift in pattern on Sunday for the ID: External. I conduct an analysis on this dataset to examine the communication patterns in greater depth and spot patterns that seem to be "odd".
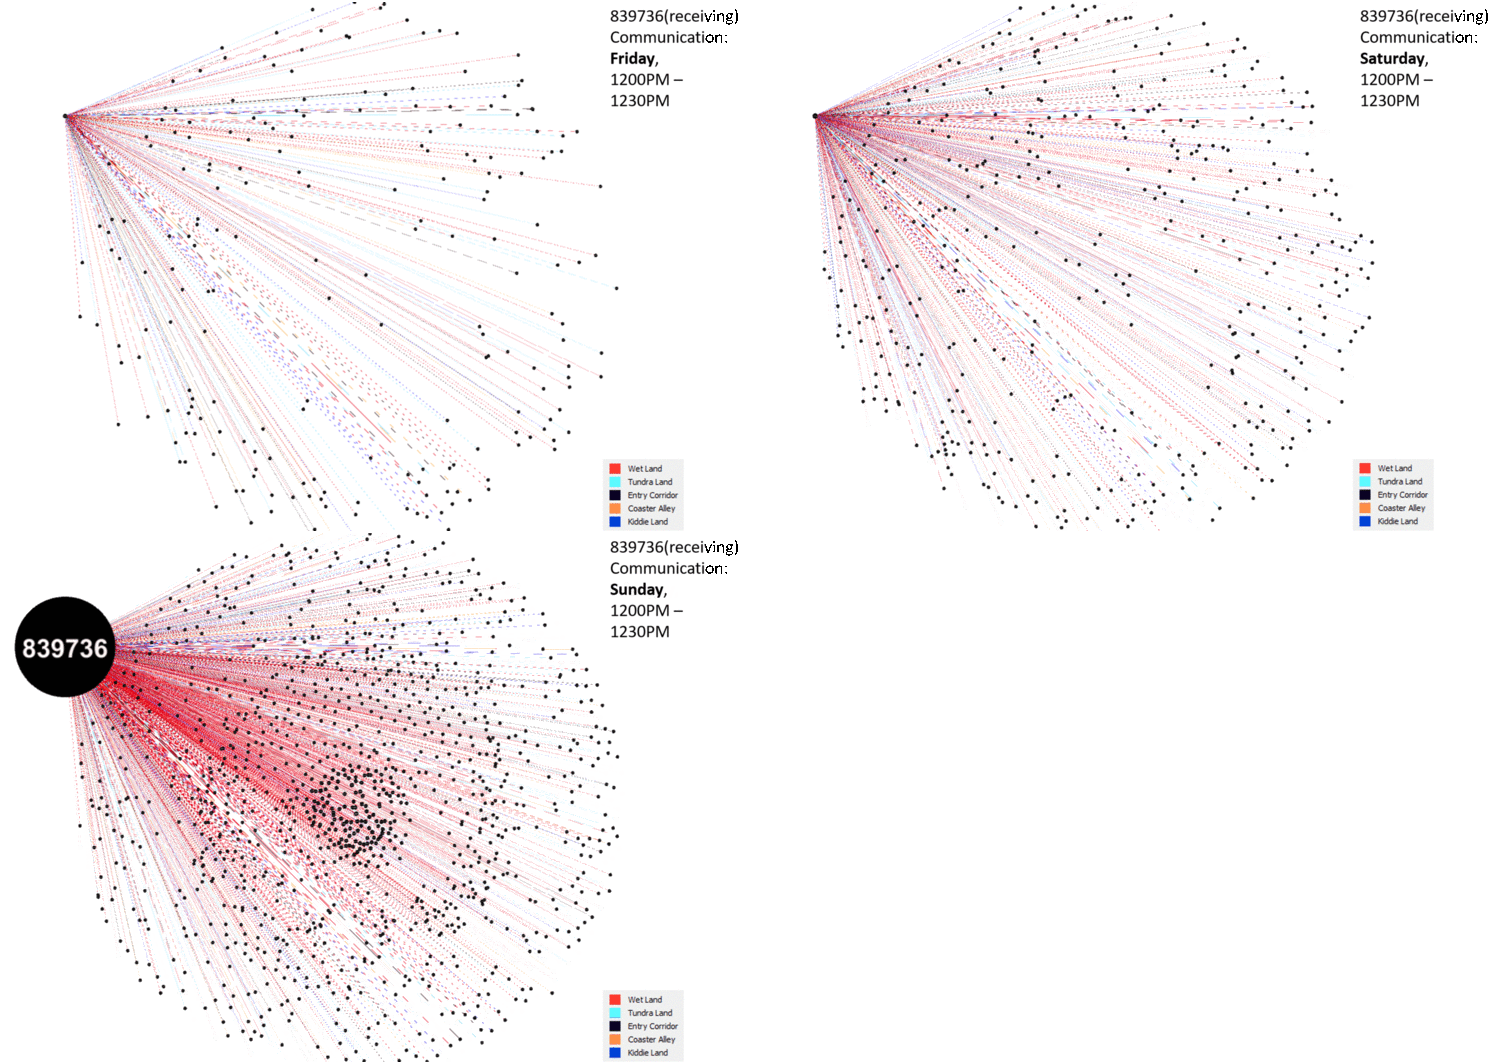
Voilah! I observe another strange pattern in the communication data for Sunday. ID 839736 has received a lot of messages from the Park Visitors at 1200PM to 1230PM. This is basically, 30 minutes after the “commotion” (the large quantity of messages sent to external IDs) I spotted in our first pattern. Could they be related?
First, at 1130AM to 1200PM a large quantity of messages were sent from the visitors to external parties.
Second, at 1200PM to 1230PM a large quantity of messages were sent from the visitors to the Dinopark’s Customer Service System (ID 839736).
What I can hypothesize from this is in a sequential format, visitors first discovered something was not right at Creighton Pavilion and started texting their friends, family and others about the news. Once they had done so, they then communicated the news to Dinopark’s Customer Service System (ID 839736).
Let us take a step back, and analyze if there could be any relationship to the Scott Jone's Exhibition at Creighton Pavilion
I will take a look at the movement data for Sunday and focus on the Creighton Pavilion to identify any patterns that stand out.
I can see that from 0800AM to 0930AM Creighton Pavilion had visitors, an increasing pattern can be observed, but this could just mean that it is correlated with the increasing number of visitors entering the park. 0930AM to 1000AM there was just a single visitor which seems odd as compared to the usual three digit figures of visitors.
From 1000AM to 1130PM there is zero check-in activity at the Creighton Pavilion. We could then hypothesize that ID 1502920 is someone who checked-in at the attraction the last. Possible scenarios: he/she could be someone who had checked-in the last at Creighton Pavilion or a Dinopark staff that was closing the Creighton Pavilion or a potential suspect.
Pattern 3: Spotting the "mutes" with similar movement data
With my interest piqued with the movement data which was offering useful insights in helping us detect something odd going on, I took a look at the movement dataset and contrasted it with the communication data. First, I identified a group with 2 check-ins (Entry 2 times), all movements and all walking in the same direction. This was odd. They had 0 communication data too. Who exactly could they be?
Illustration: Identified IDs with same patterns. One group stood out, a group of 7 had the same movement patterns. Same check-in timings. Same movement pattern.
Pattern 4: What could this group of 7 be doing?
I analysed the movement timing of the group of 7 to find out why they kept going to the Grinosaurus Stage. I can see that they first enter at 0929 and they stay at the location till 1130. Their next movement time is 1429 and they stay at the location till 1630. I can hypothesize this group was on either business purpose (setting up the show), doing a recce of the area (potentially crime planners), Scott Jone's production crew? However, based on a single pattern I cannot confirm this hypothesis.
Pattern 5: Identifying communication patterns in relation to this Group of 7's odd behavior
I then analyzed the communication patterns during this period in relation to the 3 days to see if it had any relationship with this group's behavior (which had also occurred in the same pattern for the three days) in order to support my hypothesis.
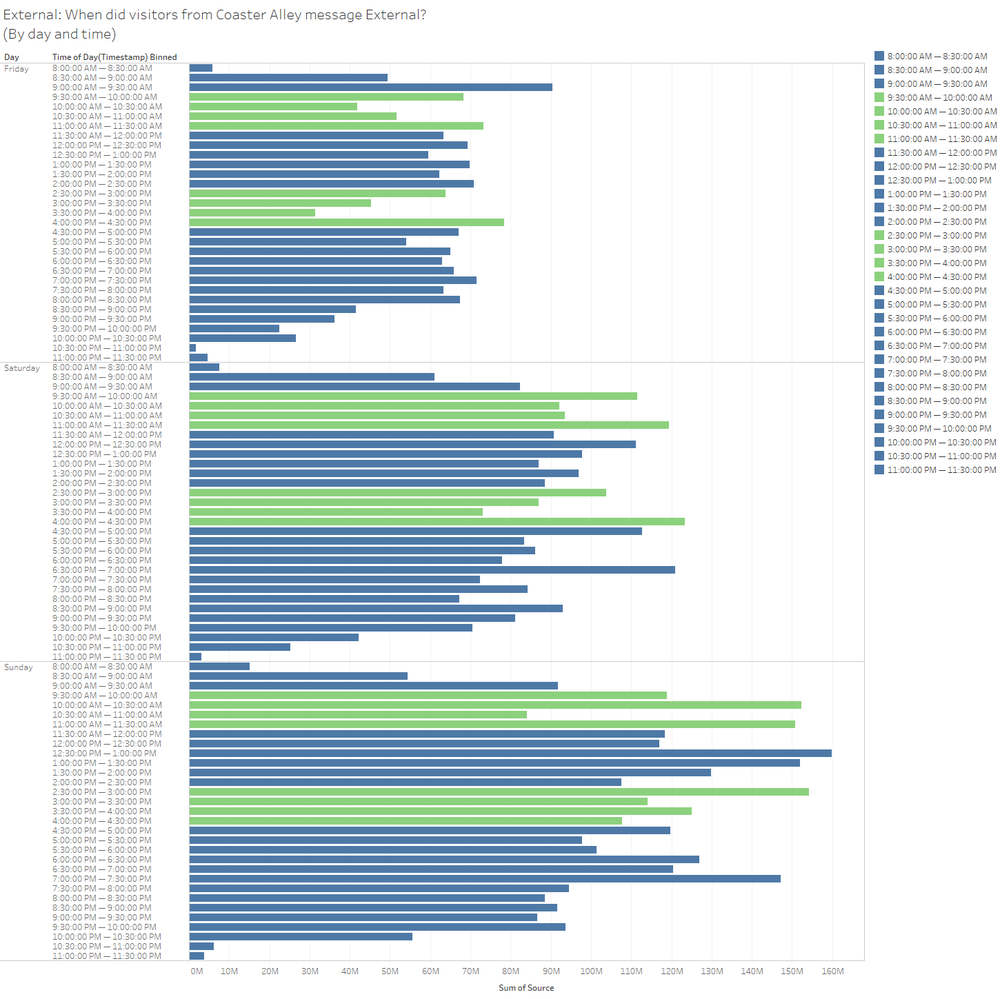
The data visualization above is used to analyze the communication at Coaster Alley (Creighton Pavilion belongs to this area), to identify a pattern with the Group 7's odd check-in/out timings and the communication patterns. We can actually see a pattern; outgoing messages to external are decreasing during these times for both Friday and Saturday. However, for Sunday, the pattern looks erratic. Most likely something was going on at the Grinosaurus Stage, a show? An event? This supports the hypothesis that they could be Scott Jone's crew, most likely the production crew or his group of close friends or family as they devote their whole 3 days to him and do not do anything else but go to the Grinosaurus Stage for two times a day and only take a break to go out of the theme park a single time. With such a hypothesis in mind, this would most likely mean the Scott Jones show or event was being held there two times a day, for two hours.
However, it must not be forgotten that on Sunday the pattern in the afternoon had changed. This discovery could potentially being linked with the other patterns documented to determine when the vandalism was discovered.
Pattern 6: Identifying and characterizing different groups of tourists based on the communication
I analyzed all 3 sets of communication data with a focus on identifying those with IDs highest out-going communication, excluding the most obvious ones which I had mentioned earlier. During this analysis I spotted similar patterns on all 3 days of communication data with slight variations in group dynamics and communication patterns, but in general the same communication pattern. Hence, I focused on one of the days (Friday) to provide a deeper insight to the pattern.

It can be observed that there are 7 huge clusters/groupings. These represent the relationships between the IDs. Each group has a large number of communication between each other, hence the cluster. This was done using Force Atlas which works on the basis of pulling strongly correlated nodes together and weakly connected nodes apart.
Focusing on Group 1, ID: 825466 which is the largest node. We can identify a communication pattern. It seems this group had a hierarchy:
- Overall group leader
- Group leader
- Mini groups (Families, couples, friends)
Similarly, the other groups do have such hierarchies. We also can see that based on the communication data above for Friday, we can see that the 1. Overall group leaders communicate each other. However, not as much as they do communicate with the group they are in-charge of, resulting in the increase in distance from the respective nodes. Overall group leaders tend to have connections with other overall group leaders, however do not communicate to them as much as they to their own group leaders. Group leaders mainly communicate within their own group, mainly their group members (mini groups), an example would be coordinating entry/exit timings with their group members, this can be seen in contrast with the mass messages sent during those times and moments later group members will exit together. Mini groups, tend to communicate amongst within their group too, however if they belong to the grouping of family/couple/friends they are unlikely to message each other as they tend to have the same moving pattern, they will talk to other group members who move in a different direction.
From this data, can you hypothesize when the vandalism was discovered? Describe your rationale.
Yes. Based on the analysis conducted above I was able to sequentially list out the different patterns leading up to the discovery
- On Sunday, 1130AM to 1200PM a large quantity of messages were sent from the visitors to external parties.
- On Sunday, 1200PM to 1230PM a large quantity of messages were sent from the visitors to the Dinopark’s Customer Service System (ID 839736).
- Identified Creighton Pavilion's opening / closing time. Closes 0930AM-1130AM, however only one ID: 1502920 checked in at 0930AM as compared to the usual hundreds at opening times. Hypothesis: Potential suspect/Dinopark Staff.
- Identified IDs with same patterns. One group stood out, a group of 7 had the same movement patterns. Same check-in timings. Same movement pattern.
- 4. (above) Helped to determine the Scott Jones show timing at Grinosaurus Stage.
- Analyzed pattern to see if there is any relationship with the previous Patterns 1,2,3,4.
- Found correlation between number of messages sent and timing of Scott Jones shows. Proving hypothesis that Group of 7 are Scott Jones production crew/party.
Conclusion (Story): The crime was first discovered on Sunday at 1130AM to 1200PM many people started messaging external parties. Then at 1200PM to 1230PM they started messaging Dinopark's customer service system, potential reasons: highlighting the crime to them, complain of Creighton Pavilion closure, curiosity in the commotion going on. Identified a potential suspect ID: 1502920 checking-in at closing time of the Creighton Pavilion. Identified IDs with same patterns, which resulted in helping determine the time of Scott Jones shows. The Scott Jones show timing was important to support the above hypothesis of crime being discovered at 1130AM to 1200PM, as on Sunday, after the first show had been conducted, the second show no longer went on, this can be determined from the change in pattern of communication during that period.

