ISSS608 2016-17 T1 Assign3 Chen Yi Fan
Contents
Overview
DinoFun World is a typical modest-sized amusement park. In this assignment, a set of visitors’ communication and movement data to this park were given. This dataset covered 3 days’ visitors’ information within the park from Friday (6 June 2014) to Sunday (8 June 2014). A tribute event was planned during this weekend named “Scott Jones Weekend” to celebrate Scott Jones, who was from a town nearby DinoFun World, years of stardom in international play. Scott was scheduled to appear in two stage shows each on Friday, Saturday and Sunday to talk about his life and career. In addition, a show of memorabilia related to his illustrious career would be displayed in the park’s Pavilion. However, the event did not go as planned. Scott’s weekend was marred by crime and mayhem perpetrated by a poor, misguided and disgruntled figure from Scott’s past.
We are tasked to detect the communication pattern among the visitors or park employees. Specifically, the following questions are set:
- Identify those IDs that stand out for their large volumes of communication. For each of these IDs, Characterize the communication patterns we see.
- Describe up to 10 communications patterns in the data. Characterize who is communicating, with whom, when and where.
- From this data, can we hypothesize when the vandalism was discovered?
Dataset Preparation
1). Communication Dataset
2). Movement Dataset
Approach
Large Volume of Communication
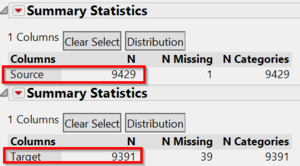
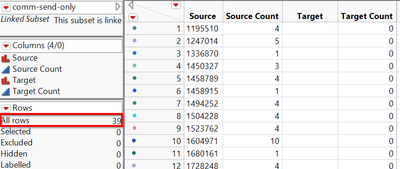
Based on the above data preparation, we could summarize there were total 9,429 unique source IDs and 9,391 target IDs for the 3 days. 1,510 or 16% were repeat IDs. Also noticed there are 39 IDs only sent but never received message.
 |
|
Among all, 2 IDs (1278894 and 839736) were the top 2 IDs communicated with others. “external” was also one of the parties received large amount of messages.
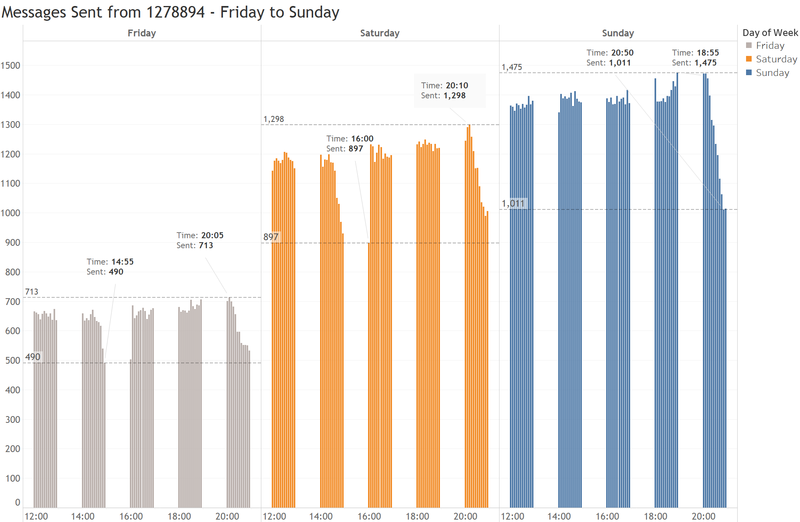
For ID 1278894, it had the same communication pattern for the 3 days. It started to send batch messages every 5 mins from 12pm to 12:55pm, 2 to 2:55pm, 4 to 4:55pm, 6 to 6:55pm and 8 to 8:55pm. Meanwhile, it also received responses from those IDs.
Due to the regular pattern and massive messages being sent out at the same time, we can hypothesis ID 1278894 is an automated system which sent messages to the IDs registered in its system at a fix interval. With the increasing visitors coming to the park during the 3 days, the messages it sent also increased with Sunday having the most messages being delivered. All of the messages were sent out from Entry Corridor.
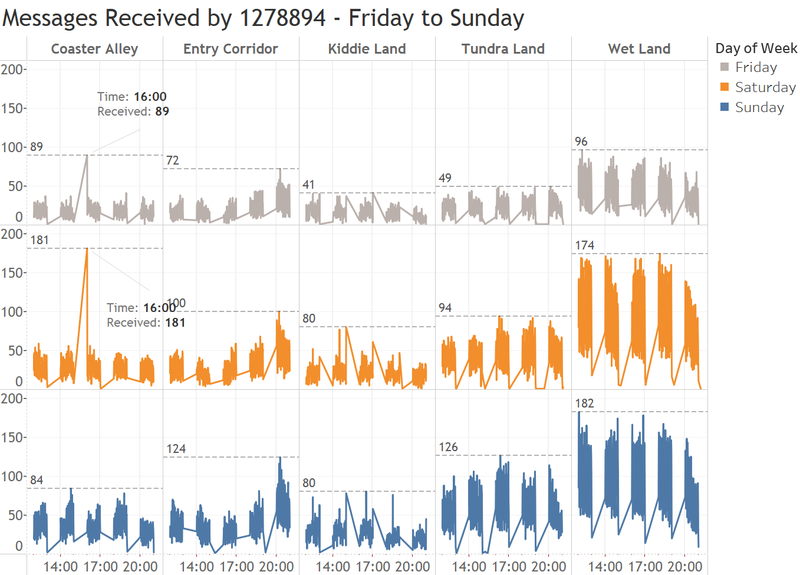
The messages 1278894 received also appeared as a periodic pattern that the number of messages ranging from a few dozens to less than 200 were received within an hour right after it sent out the first batch of messages. It might be logical to infer the messages sent out were some contest questions which only allowed park visitors to respond within an hour. Some prizes may be awarded to those who managed to send in their answers to attract visitors to participate in the game.
There were 2 peaks happened at the same time, 4pm on Friday and Saturday from Coaster Alley. Since Scott Jones visited twice per day to the park from Friday to Sunday, the contest questions sent at 4pm on these 2 days might be related to his stage show. Some of the messages flushed in could be from his fans. However, this phenomenon did not happen on Sunday. As we know, his show was marred because of a vandalism, we could infer it happened on Sunday. Therefore, we did not see the same phenomenon on Sunday.
Over the 3 days, Wet Land was the place where most messages were received.
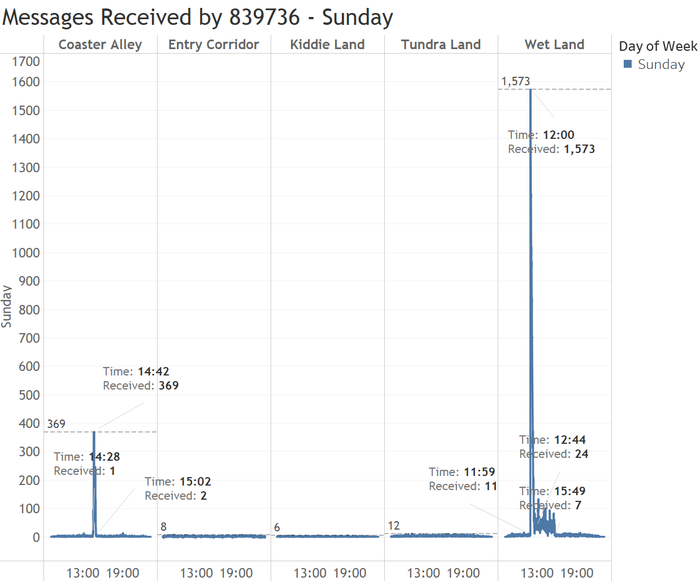
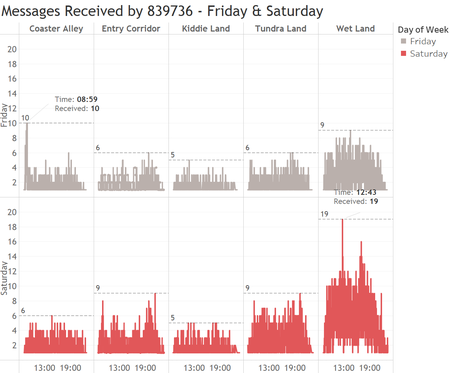
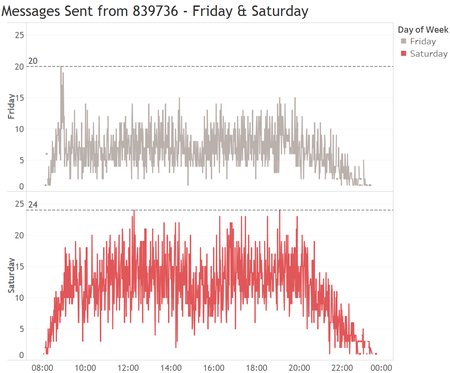
On the other hand, for ID 839736, also located at Entry Corridor, received no more than 19 messages and sent less than 24 messages on Friday and Saturday throughout the whole days.
 |
|
But on Sunday, it suddenly received 1,573 messages at 12pm from Wet Land. Until 12:44pm, it dropped to 24 messages. There were a few small spikes afterwards. It finally resumed to its usual frequency at about 15:49. Meanwhile, we could also observe a spike at Coaster Alley from 14:28 to 15:02.
From above, we could hypothesis ID 839736 was the customer service who was responsible to provide help to the visitors and respond to visitors’ questions.
When the vandalism was discovered?
Compared to the previous version, in this version I would like to study the critical event, the vandalism before explore the noticeable patterns. Because the dataset is too huge to be imported into Gephi to derive any meaningful conclusion. By narrowing down the timing and IDs to focus on, it can ease the processing in Gephi.
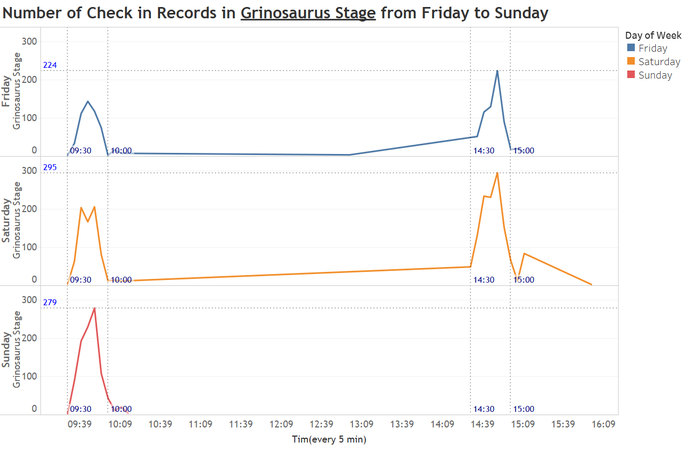
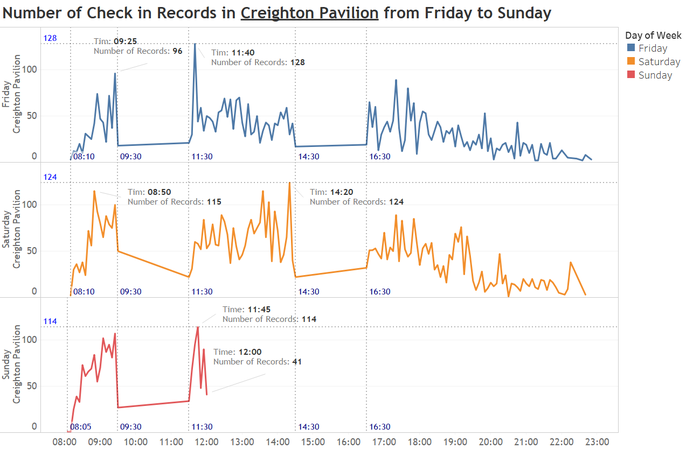
As mentioned, Scott had 2 stage shows at Grinosaurus Stage each day. This can be observed from the chart below. On Friday and Saturday, there were 2 peaks on each day. One was in the morning from 9:30 to 10:00 and another in the afternoon from 14:30 to 15:00. However, on Sunday, only the morning show performed as usual, there was no more check-in record afterwards. The show in the afternoon was cancelled due to the vandalism.
On the other hand, by examining the check-in record for Creighton Pavilion, we could notice it had fluctuation of the check-in records on Friday and Saturday from 8:10 to 9:30, 11:30 to 14:30 and after 16:30. When we look at the records on Sunday, it clearly shows there was no more check-in records after 12:00pm. Hence we may conclude the vandalism happened during 11:30am to 12:00 at Creighton Pavilion.
Noticeable Communication Patterns
1). Observation 1
From above we know the vandalism took place at Creighton Pavilion after the show started at 11:30 Sunday morning. There are a few assumptions made in order to detect the suspect:
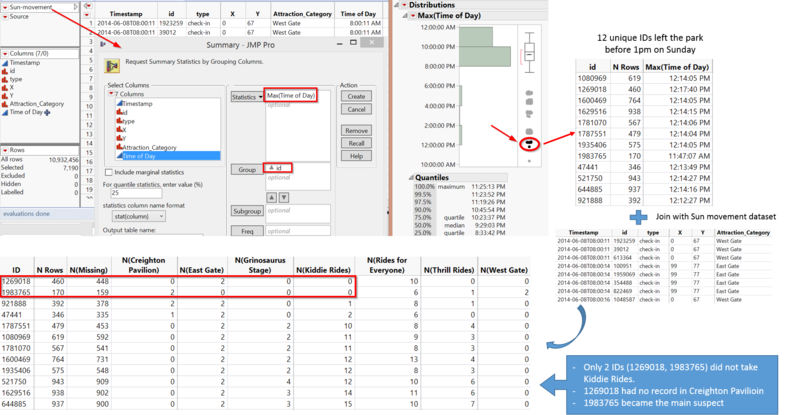
- The suspect should leave the criminal scene as early as possible after he/she had committed the crime. Therefore, it is logical to focus on the visitors who left the park before 1pm on Sunday.
- The suspect should have least communications so not to make them noticeable by others
- The visitors to the Kiddie Rides should be excluded. It was mentioned in the task overview Scott’s weekend was marred by crime and mayhem perpetrated by a poor, misguided and disgruntled figure from Scott’s past. Since the suspect was from Scott’s past, he/she should not be a kid. If he/she was accompanied with a kid, it would be difficult to commit the crime without being caught.
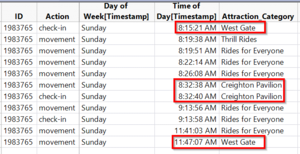
With all of above assumptions, we filter the Sunday movement data based on their last timestamp. There are 13 unique IDs left the park before 1pm. But one of them left the park at 10:19:59 AM before the vandalism happened. This ID should be excluded. By joining the other 12 IDs with the Sunday movement dataset, the summary table showed that only 2 IDs (1269018, 1983765) did not take Kiddie Rides. We also noticed 1269018 had no record in Creighton Pavilion, thus 1983765 became the main suspect. After searching his/her record from the Sunday communication dataset, there was no record found. In fact, he/she did not communicate with anybody throughout the 3 days.
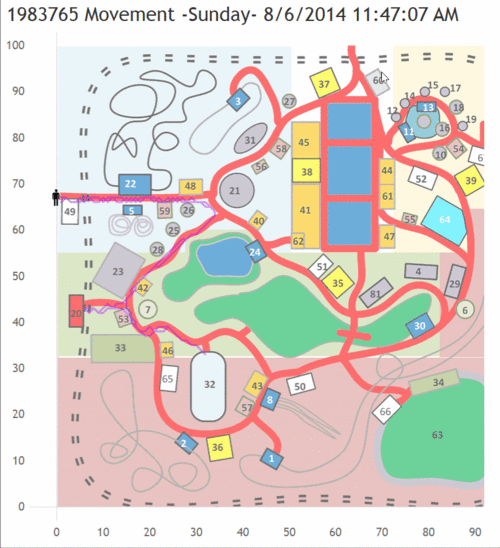
The gif chart below shows the movement path of the ID 1983765 on Sunday (open in a new window to view its movement). Also noticed the attractions he/she visited on Sunday in the table.
2). Observation 2
I’ve exported the communication data between 11:30am to 12:44pm on Sunday in order to explore more in detail on the communication pattern for the vandalism period.
The node file is generated by extracting all the unique IDs appearing on Sunday with their count of check-in and movement in each attraction. Edge file is the communication records in Wet Land from 11:30am to 12:44pm excluding the system id 1278894 and customer service id 839736.
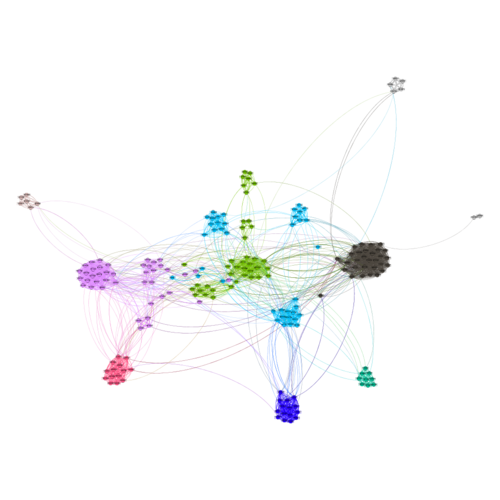
There were 7,570 nodes and 71,216 edges generated initially. After adjusting the graph by applying Giant Component with Degree Range of 100 to 700, a number of noises were removed and left with 202 nodes and 6,039. 10 communities were formed with resolution of 5 as shown in the graph below. I’ve used ForceAtlas 2 to create the layout.
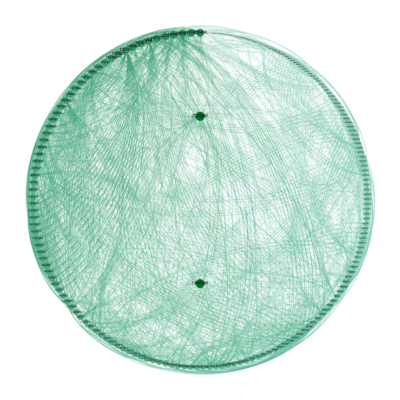
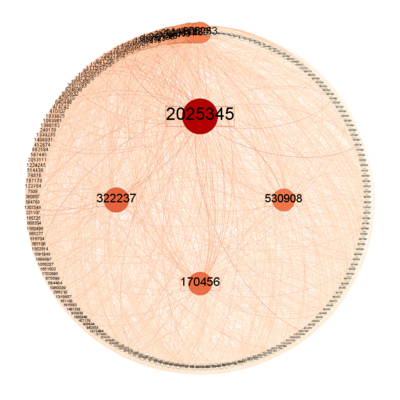
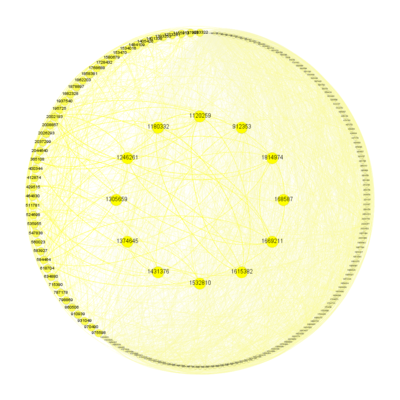
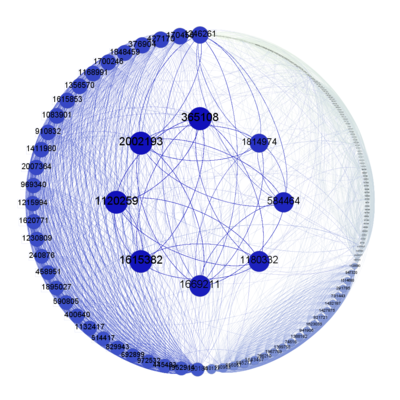
To understand the measurements of Betweenness Centrality, Closeness Centrality, Eccentricity and Eigenvector Centrality, I used Dual Circle Layout to generate the charts below.
| Betweenness Centrality | Closeness Centrality |
 |
|
| Eccentricity | Eigenvector Centrality |
 |
|
Betweenness Centrality is an indicator of a node’s centrality in a network. A node with high betweenness centrality has a large influence on the transfer of items through the network.
It is obvious 2025345 had the highest value for the betweenness centrality than the other nodes. It indicates this node was the key nodes to connect different groups.
Closeness Centrality is to measure the centrality in a network of a node. The more central a node is, the closer it is to all other nodes. There wasn’t a very prominent node with high closeness centrality value. Although I had increased the max size to 1000 to try to separate the nodes, 2025345 and 1494148 were just slightly bigger than the others.
Eccentricity measures the distance between a node and the node that is furthest from it. A high eccentricity means that the furthest away node in the network is a long way away, and a low eccentricity means that the furthest away is actually quite close. But we did not observe much differences among the nodes for this measurement as shown in the graph below.
Eigenvector Centrality measures how well a node connected to other well-connected nodes. 2002193, 365108, 1814974, 584464, 1180332, 1669211, 1615382, 1120259 appeared to be more well connected to the other nodes as shown in the blue color graph below.
3). Observation 3
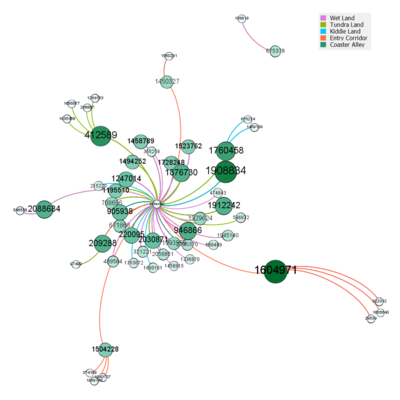
As mentioned earlier, there were 39 ids which only sent messages without receiving. The graph below showed the nodes in green for their out-degree. Edges were color coded by their sent location. 1604971 appeared to send more messages than others to external as well as its own group 922332, 1605640 and 29539. The messages were sent from Entry Corridor. Another 2 ids 1760458 and 209288 sent messages to external and their own group from different locations. 1760458 sent to external from Tundra Land and to 676274, 1469139 from Kiddie Land. Similarly, 209288 sent to external from Entry Corridor and to 97490 from Tundra Land. There were 2 isolated nodes, 675378 and 158818, which only communicated with each other.
Visualization
https://public.tableau.com/profile/chen.yifan#!/vizhome/Assignment3_ChenYiFan/DunoWorld
The dynamic network diagram wasn't created successfully. I had created a node file by extracting each id's start time (the time they first time checkin) and end time (the last time they left the park) for Fri, Sat and Sun. Using either Coaster Alley or Wet Land communication data as edge file. The timeline was created but there wasn't any significant movement of the nodes when the time changed. I noticed the interval time generated from start time and end time for quite a number of nodes were infinite although there was differences between each node's start time and end time. This would be my future work for this assignment when time permits’’
References
- Learn how to use Gephi
- Gephi Wiki
- Visual Analytics Benchmark Repository
- A Tutorial – on dynamic networks
- Past year schoolmate Mervyn's work on how to create a dynamic network chart
- Fellow classmate Li Dan's approach on how to detect the suspect step by step


