ISSS608 2016-17 T1 Assign3 Alvin Yuen
Contents
Objective
Three days worth of communications and movement data from a three day event in DinoFun World were provided for this exercise, where students would have to attempt to identify patterns and IDs with large volumes of dataset. After which a hypothesis on the probable time in which the vandalism at the park was discovered were to be proposed.
Data Overview
Over the course of a three days period spanning from 6th June 2014 to 8th of June 2015, a weekend tribute to the world renowned football player Scott Jones had been held in the DinoFun World. Scotts was scheduled to appear across the three days in two stage shows on each of the three days to celebrate the achievement he had made. However, the celebratory occasion was affected by a Vandalism case which was resolved quickly.
The in-app communication data over the three days of this event was provided to the students, with information of the source and target IDs in each communication was transmitted. In addition movement data were tracked to determine if individuals had moved or check-in at a particular location.
Data Preparation
- Assignment of the additional field "Day" to the three sets of raw communications dataset to act as an identifier for which the communication occurred.
- Combination of all three communication datasets into a single combined dataset for visual representation in tableau.
Gephi Node & Edge Data Set
- To utilise the Gephi software for creation of the network graph, the communication dataset would have to be segregated into a list of nodes and a list of edge. The raw dataset is processed with R to retrieve only the distinct IDs, and all the IDs are labelled with their respective IDs.
- The edge file is created by retrieving only the "From" and "To" columns from the original dataset, the header names are renamed to "Source" from "From" and "Target" from "To". The "Type" and "Weight" columns are added into the Edge dataset.
Communication Patterns
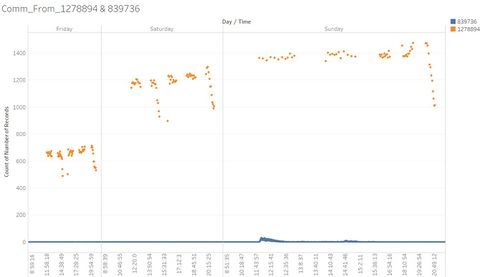
As can be observed from the chart on the left, there are two particular IDs, “839736” and “1278894”, which consistently sent out abnormally high volume of communications throughout the three days.
Outliers
Two patterns which can be observed from the chart on the left are that communication from “1278894” only occur in specific time period of the day while “839736” has a significantly lesser volume but consistent communication throughout the day. The volume of communications from "1278894" is also substantially higher than that from "839736".
ID 1278894
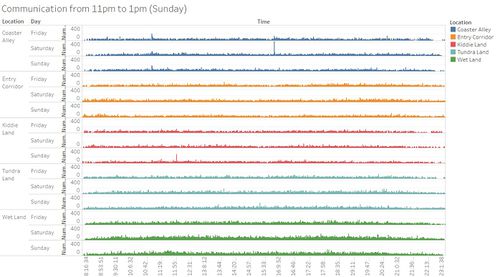
The communication from the source ID “1278894” was sent exclusively from the Entry Corridor of the theme park. In addition, the communication was sent in a regular timeframe in each day, from 12.00pm to 12.55pm, 2.00pm to 2.55pm, 4.00pm to 4.55pm, 6.00pm to 6.55pm and 8.00pm to 8.55pm. Each communication from this ID is sent at a regular time interval of 5-minute.
ID 839736
Similar to the communication from ID “1278894”, the communication from ID “839736” originated only from the Entry Corridor. It can be observed that the communication from this source was sent almost continuously throughout the operating hours of the theme park. The volume of communication sent out was consistent across the whole day for both Friday and Saturday, however, on Sunday it can be noted that that is a huge spike in volume of communication sent out by this source at approximately 11.40am and subsided at approximately 12.30pm. Another minor spike in volume of communication sent was observed at approximately 2.40pm on Sunday and lasted about 20 minutes.
Network Graph of ID 1278894 & ID 839736
| ID | Degree | Degree Rank |
|---|---|---|
| 1278894 | 38658 | 1 |
| 839736 | 5914 | 2 |
| 1196426 | 64 | 3 |
Analysing the network graph plot of the communication originating from the two sources indicates that the two sources have a huge network of communication with almost all the distinct IDs source. The degree of connection table above indicates that both ID 1278894 and ID 839736 have significantly high degree value relative to the next closest ranked originating source, this indicates that these two IDs has much more connections than the rest of the source IDs in terms of communication origin.
Hypothesis
- Judging from the frequency of communication of the ID 1278894 and the volume of communication sent, it can be hypothesized that this communication source is probably a regular public broadcast announcement for shows or activities at a certain time period in the theme park.
- It can also be hypothesized that ID 839736 is a public announcement source as it is sent to almost all the records and is consistently occurring throughout the day.
Communication From All with exclusion of ID 1278894 & ID 839736
When did the vandalism occurred?
Abnormality in Communication Volume on Sunday
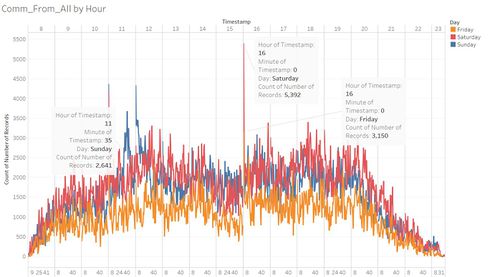
Examining the breakdown of the communication patterns on Saturday and Sunday revealed that there are two spikes in volume of message sent on Saturday and Sunday. On Saturday it is for a single moment at 4pm. However on Sunday, from approximately 11.35am to about 12.20pm, there was a sustained increased in communications sent. The single spike in communication at 4pm could also be observed on Friday, hence this spike in volume of communication sent on Saturday does not seem to be out of the norm.
Communication to External on all three days
Communication to external was fairly constant throughout all three days, however there is a spike in communication sent from the visitors in the theme park to external from approximately 11.41am till 12pm on Sunday. In addition the spike in communication sent to external occurs exclusively in the Wetland Area, which is close to the Creighton Pavilion where Scott is slated to perform at.
Hypothesis
- The vandalism incident most likely occurred on Sunday, at close to 11.40am. One possible supporting evidence is the spike in communication sent to external at this particular time frame. As this would likely be the time where the vandalism was spotted and announced. The visitors would be inclined to communicate this information to their family or friends who are not in the park about this crime.
- Another supporting evidence is the location in which the increase in communication to external originated, as the Wetland Area is located close to the Creighton Pavilion, it is possible that there was a rise in communication volume at the Wetland Area as many of the visitors would be travelling towards the area for the performance. The spike in communication could occur when the vandalism was spotted and sent from the Wetlands area.
- Another supporting evidence to this hypothesis is the increase in communication from ID 839736, which I had earlier inferred to be that of the public announcement system source of the theme park, from approximately 11.50am on Sunday to about 12.20pm. This could be due to the increase in communication from the theme park staff to the visitors as the vandalism was discovered. Possibly to assure the visitors and to announce the cancel of Scott's performance.
- There was also a spike in communication from ID 839736 at 2.40pm on Sunday, which may be because of a second communication to the visitors with regards to the incident.
Tools Utilised
- Tableau 10.0
- JMP Pro 12
- RStudio
- Gephi 0.9.1


