ISSS608 2016-17 T1 Assign3 Aditya Hariharan
Overview
DinoFun World is a typical modest-sized amusement park, sitting on about 215 hectares and hosting thousands of visitors each day. It has a small town feel, but it is well known for its exciting rides and events.
One event last year was a weekend tribute to Scott Jones, internationally renowned football (“soccer,” in US terminology) star. Scott Jones is from a town nearby DinoFun World. He was a classic hometown hero, with thousands of fans who cheered his success as if he were a beloved family member. To celebrate his years of stardom in international play, DinoFun World declared “Scott Jones Weekend”, where Scott was scheduled to appear in two stage shows each on Friday, Saturday, and Sunday to talk about his life and career. In addition, a show of memorabilia related to his illustrious career would be displayed in the park’s Pavilion. However, the event did not go as planned. Scott’s weekend was marred by crime and mayhem perpetrated by a poor, misguided and disgruntled figure from Scott’s past.
While the crimes were rapidly solved, park officials and law enforcement figures are interested in understanding just what happened during that weekend to better prepare themselves for future events. They are interested in understanding how people move and communicate in the park, as well as how patterns changes and evolve over time, and what can be understood about motivations for changing patterns.
Data Set
The Dataset used for the analysis was taken from elearn and contains the following:
Movement Data of the visitors
Communication Data of each of the visitors
Theme
The purpose of this analysis is to answer three basic questions related to security in the area and the unfortunate event that took place on the "Scott Jones Weekend":-
1.) Identify the IDs that stand out for their large volumes of communication. For each of these IDs
a) Characterize the communication patterns seen
b) Based on these patterns, hypothesize about these IDs
2.) Describe communication patterns. Characterize who is communicating with whom, when and where the communication is happening.
3.) From this data, hypothesize when the vandalism was occuring.
Analysis
Task 1
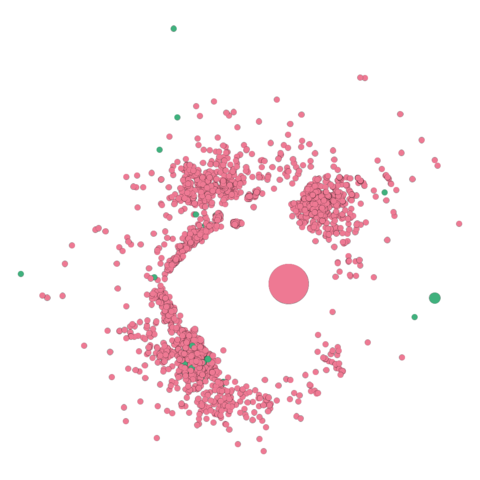
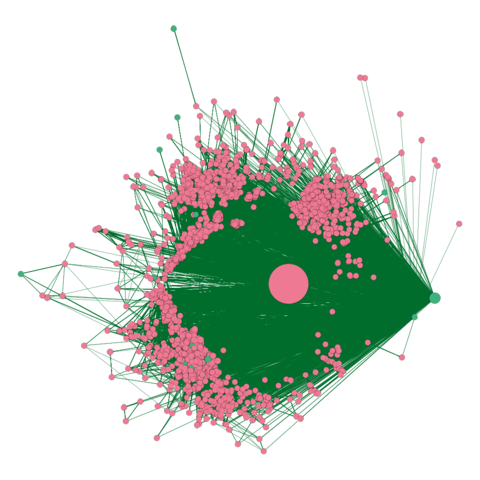
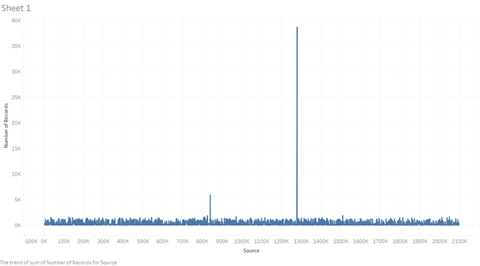
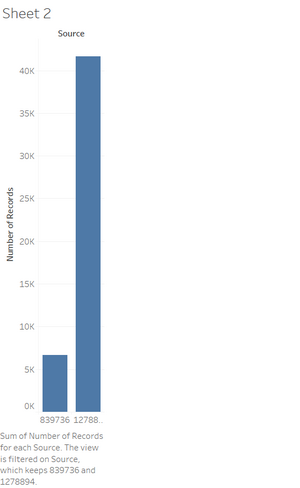
From the images above we can see that two nodes stand out for the amount of communication that has been done comparatively speaking. These nodes are 1278894 and 839736.
Movement data shows us that these have been done from the same exact location and have no movement. All communication has been done from one of the entry corridors.
The extreme number of messages being handled by these nodes indicated them as part of the park information authority or the Cindysaurus Rex Trivia Games' puzzle blast to all of the park's visitors.
While node 1278894 handles an average of more than 40k incoming and outgoing messages all the while replying within 5 minutes of each message, 839736 handles an average of 5k+ data per day on all of the three days.
Task 2
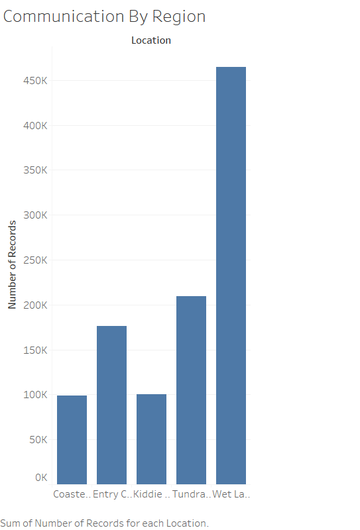
Pattern 1: The first pattern we can notice is that the maximum amount of communication happens from the wetland region on all of the three days
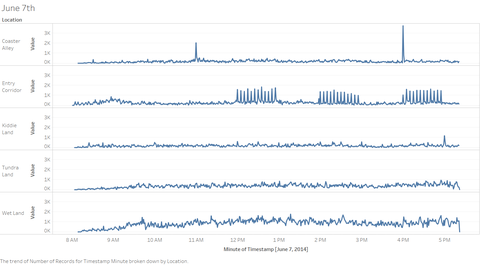
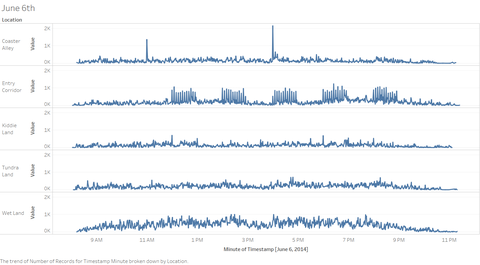
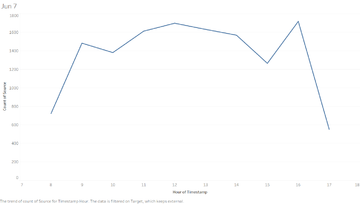
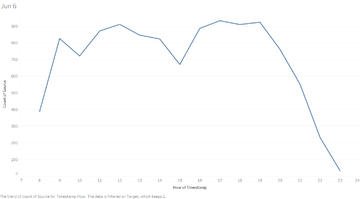
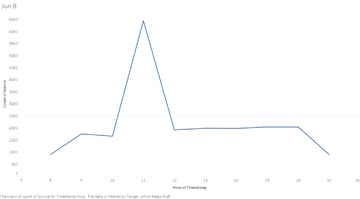
Pattern 2: When we classify the amount of communication done according to a time series taking timestamp as the variables, we see that there is an abrupt spike in communication at 11am and 4pm at coaster valley. This could be attributed to the entertainment show that starts there at these times.
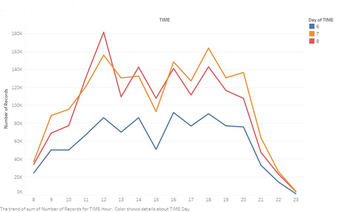
Pattern 3: The total volume of communication peaks on Sunday. This could be an effect of the vandalism on the day or because it is a public holiday
Pattern 4: When we examine communications to external parties for the three days, we see an unusual spike in communication on the third day (Sunday) between 11am and 12am which amounts to certain suspicion. This could also point towards the time of occurence of the vandalism.
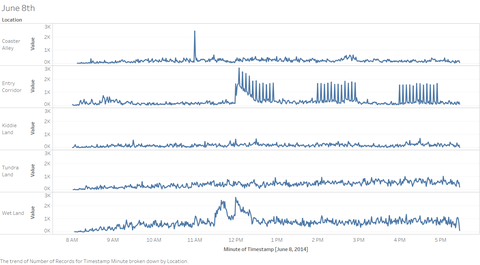
Pattern 5: Another very suspicious pattern which is perhaps directly related to the site of vandalism is the spike in communication at the Wetlands area between 11.30 and 12 and then again from 12 to 12.30 which can be seen in the images from pattern 2. This pattern was not seen on either of the days except Sunday when the vandalism had actually occured.
Pattern 6: On all three of the days one could discern from the graphs shown under pattern two that there were spikes in communication at the entry corridor on 5 intervals. This could be because of people receiving and answering questions from the Cindysaurus trivia game
Pattern 7: We can see from the image of communication data on Sunday in Pattern 2 that there was no peak in communication at 4pm. This was probably due to the act of vandalism that had occured after 11.30am at Wetlands. The authorities might have closed the show at this time.
Task 3
So from the patterns observed above namely:-
1) The spike in communications data after 11.45am
2) The spike occuring in the Wetlands area.
3) The spike in communications to external parties around 12am.
It can be discerned that the vandalism occured at 11.45am on Sunday 8th June during Scott Jones' weekend
Tools Used
Gephi
Tableau
Jmp
