ISSS608 2016-17 T1 Assign2 ZHANG Zhe
Contents
Introduction
Wikipedia and education often go together. Wikis are sometimes used in classrooms for collaborative projects. Some teachers have found, however, that learners prefer to add their own content rather than rewrite others' work, perhaps because of an institutionally cultivated norm of individual ownership. Some students also express shyness about exposing their work to be viewed by others. Such transparency seems to reduce plagiarism. In addition, Wikis also could help teacher to do lesson preparation.
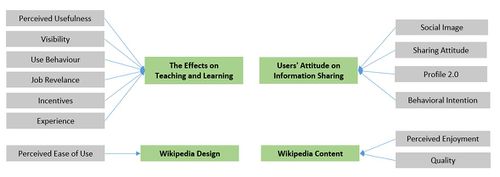
This research was held in 2015 and focus on university faculty perceptions and practices of using Wikipedia as a teaching resource. The survey items include 13 sections, Perceived Usefulness, Perceived Ease of Use, Perceived Enjoyment, Quality, Visibility, Social Image, Sharing Attitude, Use Behavior, Profile 2.0, Job Relevance, Behavioral Intention, Incentives and Experience. The goal of this research is to help Wikipedia find its shortcomings and improve itself.
Data Preparation
- Missing Data
In the original file, missing data was expressed by symbol ‘?’. However, other data are all numbers, and it would be difficult to deal with the whole file later. Wiki4HE.csv was opened in JMP with preview, then check ‘Other’ in ‘End of Field’ and input English character ‘;’. The next step is replacing all missing data ‘?’ by space. Finally save it.
- Data Type
Although some demographic information shows numbers, these numbers represent specific meanings. When the file was imported into Tableau, all variables’ data types were defaulted as number(whole). According to the attribute information, types of GENDER, DOMAIN, PhD, UNIVERSITY, UOC_POSITION, OTHER, OTHER_POSITION and USERWIKI were changed to string.
- Puzzling Information
In the file imported, Other Position has 2 levels, ‘1’ and ‘2’. Otherstatus has 7 levels, from 1 to 7. These information conflicts with data set attribute description on the website. To fit the dataset description, we modify the 2 columns names on the Tableau to Other and Other Position, respectively. Data Content
- Data Integration
Group Questions
There are 13 sections in this survey. According to details of each section, we could do the further classification to analyze better and visual more friendly.
The specific process is shown as below. There are 4 parts now. Pivot all survey questions and change the 2 columns to Survey Items and Score, separately. Right click Survey Items and choose Create → Group, then group relative questions based on the dataset description. Finally change column name to Sections.
Repeat the previous step on 13 Section by the classification as stated above. And name it Parts.
Group Age and Yearsexp
Age was divided into 3 groups and Yearsexp was divided into 4 groups.
- Computing Averages
Based on the previous step, there are 13 sections now.
Compute average of each section.
Visualization and Analysis
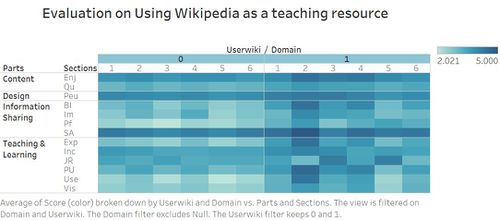
In the whole, users gave more positive responses than non-users in the general. And the scores on the use behavior, visibility, sharing attitude and profile 2.0 are the main low-score sections. Even in the crowd of users, the scores of use behavior and visibility are also not high. The negative response on the 2 aspects is obvious.
Demographics
In 913 respondents, the majority are non-users, accounting for nearly 86%. Gender ratio and PhD ratio are balance relatively. Over 87% of respondents are from UOC university, and most people from this university are adjuncts. And almost half work as part-time in another university. As for the years of university teaching experience, nearly half of them has over 10-year experience.
Evaluation on Wikipedia Design
 a.  Avg_PEU_Percent1: sum(if [Avg PEU] = 1 then -1 else 0 end)/sum([Number of Records])

 b.  Avg_PEU_Percent2: sum(if [Avg PEU] = 2 then -1 else 0 end)/sum([Number of Records])

 c.  Avg_PEU_Percent3_neg: sum(if [Avg PEU] = 3 then -.5 else 0 end)/sum([Number of Records])

 d.  Avg_PEU_Percent3_pos: sum(if [Avg PEU] = 3 then .5 else 0 end)/sum([Number of Records])

 e.  Avg_PEU_Percent4: sum(if [Avg PEU] = 4 then 1 else 0 end)/sum([Number of Records])

 f.  Avg_PEU_Percent5: sum(if [Avg PEU] = 5 then 1 else 0 end)/sum([Number of Records])
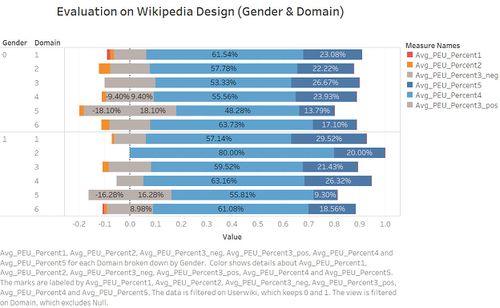
Create calculated field as shown above to do the divergent bar chart.
In general, on the perceived ease of use, evaluations from female are better than that of male, especially the female in the sciences domain. There is even no negative feedback from this crowd. However, male in the science domain gave quite a few negative responses. Whether female or male, good-sized people who do law and politics job kept neutral on the Wikipedia design.
Wikipedia design principles are simple, incremental, organic, overt, unified, precise, tolerant, Mundane, universal, observable and convergent. Maybe this design style could not satisfy everyone. Wikipedia could make a little change based on the original design principles.
Evaluation on Wikipedia Content
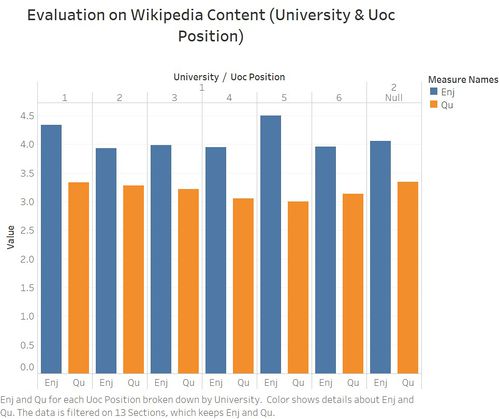
Users are more satisfied on the perceived enjoyment, and the average scores of that all above 4. The attitude of users on quality is just maintain neutral and scores are around 3. In the whole, the majority roughly agree the use of Wikipedia could stimulate curiosity and is entertaining. But when related to the specific content, such as reliability, updated speed, editing system and so on, Wikipedia still need continuous improvement.
Overall, Wikipedia is entertaining in the whole. But it still has a big progressive space on the articles quality and updated speed. After all, the main purpose of using Wikipedia is to obtain knowledge.
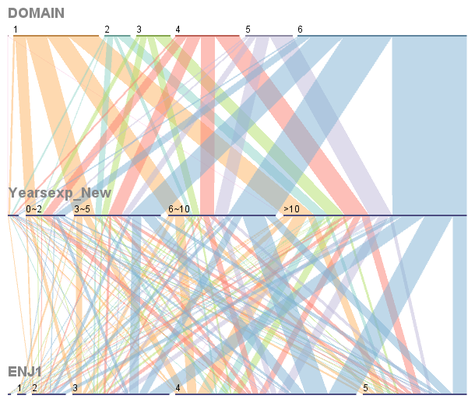
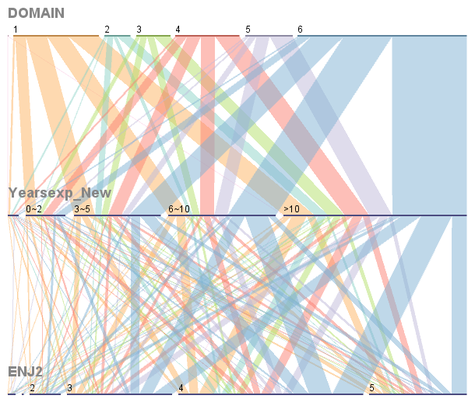
Evaluations on both ENJ1 and ENJ2 are almost same. The majority of them think they get the satisfactory enjoyment when using Wikipedia. The condition in each domain and teaching experience is similar.
Evaluation on Effects on Teaching and Learning
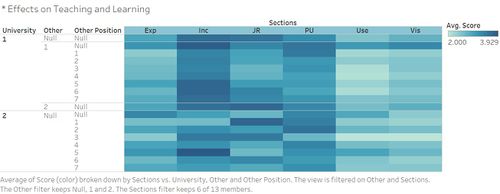
There is nearly no differences between faculty from UOC and UPF.
Users gave high evaluation on the incentives. Wikipedia is indeed a helpful tool for teaching and learning. However, feedbacks on use behavior and visibility is not satisfactory. Wikipedia focus on the concept explanation and it is insufficient on the academic working. In addition, promotion efforts from university faculty to others is not enough.
It is not common that Wikipedia is applied in the courses. As a result, Wikipedia could develop more functions on this aspect and popularize it in courses.
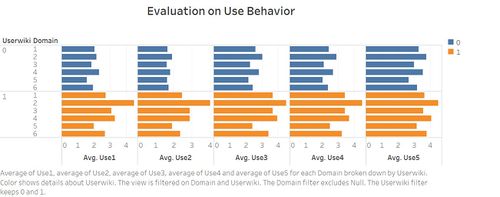
In the evaluation on use behavior, seldom faculty use Wikipedia to develop teaching material and use it as a platform to develop educational activities with students. It illustrates the Wikipedia is not too much academic and professional, and it is not suitable to be used as a teaching tool.
Attitude on Information Sharing
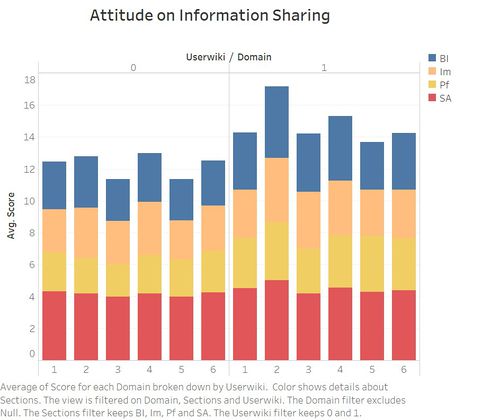
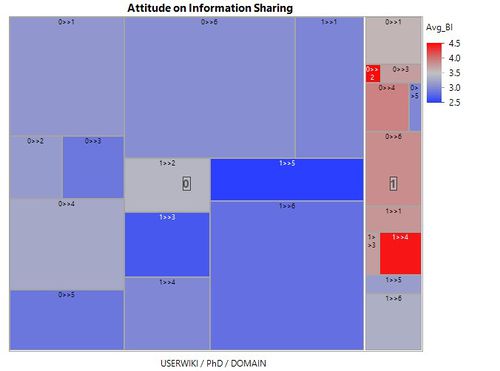
Wikipedia users are more willing to share information than non-users and their sharing attitude is positive generally, especially in the part behavioral intention.
In the future users have stronger desire to recommend the use of Wikipedia to their colleagues and students, and use it in their teaching activity. Phd in the non-users have the lowest aspiration to do that, especially crowd engaged in law or politics.
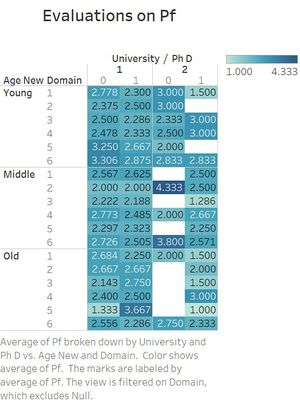
In the whole, faculty from UPF are less active than that from UOC, especially the phd in UPF. In addition, UOC is more comprehensive and has phd and non-phd in every domain and in each age group. In UOC, the responses on PF maintain neutral in general. However, the contribute to Wikipedia in another university is more extreme, and the average score of non-phd in sciences domain while is in middle age group is up to 4.33. The middle age group in UPF gave the most active responses.
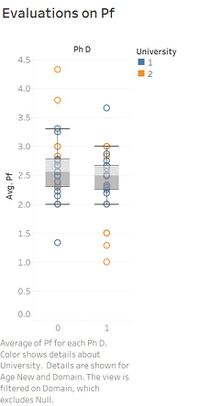
From the graph at the right, the average score of PF in non-phd is higher than that in phd and the score range is wider. In the other hand, scores of non-phd in UPF is higher than that in UOC generally. On the contrary, scores of phd in UPF is lower in the whole.
Recommendations
- The majority of respondents gave high evaluations on the Wikipedia design. Concise design style is loved by people. Wikipedia should keep its design principle.
- Wikipedia should pay more attention on the articles quality, and continually make them more academic and professional.
- Use behavior and visibility are weaknesses of Wikipedia development. The 2 aspects deserve obtain more attention.
- In the whole, users give more positive feedback than non-users. Wikipedia should take measures to give it more publicity, meanwhile improve its service quality.
Interactive Visualization
The URL could be found here: https://public.tableau.com/profile/publish/Assignment2_ZHANGZhe/Story1#!/publish-confirm
The first one is the overall view, and the second one is evaluations on 4 parts. The 4 graphs represents responses on 4 parts: Wikipedia Content, Wikipedia Design, Effects on Teaching and Learning and Respondents' Attitude on Information Sharing. Through the filter pane on the right, the information about specific items could be checked.
