ISSS608 2016-17 T1 Assign2 Shishir Nehete
Contents
- 1 Abstract
- 2 Theme of Interest and Motivation
- 3 Tools Utilised
- 4 Interactive Result
- 5 Results
- 5.1 Analysis of Respondents who have taken part in the survey.
- 5.2 How do Wiki users across domain rate perceived usefulness of Wikipedia.
- 5.3 How do users across domain and age group rate Visibility of Wikipedia.
- 5.4 How comfortable are the users with Sharing their work on Wikipedia.
- 5.5 How does Experience of the users matter in the investigation.
- 5.6 How do users across domains rate Wikipedia in terms of the quality.
- 6 Citations
- 7 Comments
Abstract
As the use of technology increases in data collection and storage in organizations, the demand for finding the insights from this data is a growing concern. Currently, most of the traditional business intelligence systems tend to confine to univariate and bivariate data analysis.
The Project focuses on applying interactive data exploration and analysis techniques to discovery patterns in multivariate data to explore different relationships in the data.
The topic used for exploring these techniques is “University faculty perceptions and practices of using Wikipedia as a teaching resource”. This is an ongoing research in which perception of colleagues and opinion about Wikipedia and the perceived quality of information in Wikipedia play a central role.
Theme of Interest and Motivation
The dataset used for this project is wiki4HE Data Set(https://archive.ics.uci.edu/ml/datasets/wiki4HE).
Identifying a theme of interest
The dataset provides information of the survey providers on multiple variables such as:
Age, Gender, Domain, PhD, Experience, University (Universitat Oberta de Catalunya, Universitat Pompeu Fabra), UOC_Position, Other, Other_Position, UserWiki
The survey consists of questions in following categories to analyse the use of Wikipedia for education purposes.
- Perceived Usefulness
- Perceived Ease of Use
- Perceived Enjoyment
- Quality
- Visibility
- Social Image
- Sharing attitude
- Use behaviour
- Profile 2.0
- Job relevance
- Behavioural intention
- Incentives
- Experience
To define the scope of the assignment, I am considering 5 of the above list of variables. Limiting the scope will provide me a confined field of analysis which can be furthered to other variables too. These variables are Perceived Usefulness, Quality, Visibility, Experience and Sharing Attitude.
Data Preparation
1. Import Data in JMP Pro for data preparation.
- The data consists of 913 rows for the responses by the users.
2. Check for Missing Data pattern.
- After initial analysis, the data consists of inconsistencies in terms of the attribute values. There are a number of missing values in multiple attributes. Following steps describe the fix for these missing values by studying the data dictionary provided with the data set.
3. Check for attribute appropriateness with the data set description.
- Following are the attributes provided in the data dictionary.
     AGE: numeric
     GENDER: 0=Male; 1=Female
     DOMAIN: 1=Arts & Humanities; 2=Sciences; 3=Health Sciences; 4=Engineering & Architecture; 5=Law & Politics
     PhD: 0=No; 1=Yes
     YEARSEXP (years of university teaching experience): numeric
     UNIVERSITY: 1=UOC; 2=UPF
     UOC_POSITION (academic position of UOC members): 1=Professor; 2=Associate; 3=Assistant; 4=Lecturer; 5=Instructor; 6=Adjunct
     OTHER (main job in another university for part-time members): 1=Yes; 2=No
     OTHER_POSITION (work as part-time in another university and UPF members): 1=Professor; 2=Associate; 3=Assistant; 4=Lecturer;
     5=Instructor; 6=Adjunct
     USERWIKI (Wikipedia registered user): 0=No; 1=Yes
While comparing the attributes, following observations are made:
- Age, Gender, Yearsexp, University do not have any discrepancy.
- DOMAIN: This domain has an extra value (6) and missing values which needs to be taken care of. Hence, recoding the Attribute values as below:
     1=Arts & Humanities
     2=Sciences
     3=Health Sciences
     4=Engineering & Architecture
     5=Law & Politics
     6=Others
     ?=Unknown (7)
- Yearsexp: There are 23 records that are missing values for this attribute.
As this number is not very significant (2.5%) recoding these as ‘0’.
- UOC_POSITION (academic position of UOC members): This is a field which is specific for University type 1 (UOC), so recoding the missing values as NA for another type of university.
     1=Professor
     2=Associate
     3=Assistant
     4=Lecturer
     5=Instructor
     6=Adjunct
     ?=NA (7)
- OTHER (main job in another university for part-time members): This attribute is also specific to UOC as all the records for UPF. Recoding the missing values as NA
     1=Yes
     2=No
     ?=NA (3)
- OTHER_POSITION (work as part-time in another university and UPF members): This attribute has 1 extra classification which is recoded as Other and missing values are recoded as NA.
     1=Professor
     2=Associate
     3=Assistant
     4=Lecturer
     5=Instructor
     6=Adjunct
     7=Other
     ?=Unknown (8)
- USERWIKI (Wikipedia registered user): This attribute defines whether the users are registered users if Wikipedia or not. There are 4 records where the data is missing. Hence, recoding this data as Unknown.
     0=No
     1=Yes
     ?=Unknown (2)
4. Change data types of the attributes.
- Gender: Numeric, Nominal
- PhD: Numeric, Nominal
- Yearsexp: Numeric, Continuous
- University: Numeric, Nominal
- All Question attributes: Numeric, Continuous
5. Create new columns to understand the attributes better.
- Gender
- Domain
- PhD
- University
- UOC_Position
- Other
- Other_Position
- UserWiki
6. Exclude and hide attributes that are out of the scope of the assignment.
7. Export data in csv format which can be used for further visualization in another tools. (<v2>)
Define questions for investigation
Using above variables, the questions for investigation can be framed as below:
- Analysis of Respondents who have taken part in the survey.
- How do Wiki users across domain perceive usefulness of Wikipedia.
- How do users across domain and age group rate Visibility of Wikipedia.
- How comfortable are the users with Sharing their work on Wikipedia.
- How does Experience of the users matter in the investigation.
- How do users across domains rate Wikipedia in terms of the quality.
Tools Utilised
- JMP – To explore and transform the data into usable data set. Also used to check distribution of the ratings for selected questions in scope of the assignment.
- Tableau – To create interactive data visualizations for finding insights and relationships between multiple variables.
- High-D – To create interactive visualization for analysing the quality criteria of the Wikipedia survey.
Interactive Result
Results
Analysis of Respondents who have taken part in the survey.
As per the data, following observations can be made out regarding the respondents who have taken part in the survey.
- Majority of the respondents are from the UOC (88%).
- The number of respondents holding PhD is slightly on the lower side (46%).
- The respondents are distributed across the gender almost uniformly though male population slightly dominates (58%).
- One of the most notable observation from the survey data is that the majority of respondents are not registered users of Wikipedia. This is an important observation because studying the pattern of these respondents can give a hypothesis of further growth of use of Wikipedia for education.
- UOC Position is specifically for one university and the majority of the number of respondents are adjunct. Following are the associates and assistants in the list of respondents. Though the position of a big chunk of respondents has not been captured.
- From the above insights, we now can deduce that the use of Wikipedia in the surveyed universities is just the beginning. Analyzing the survey might give us an insight of the pattern of usage and perception of these respondents.
How do Wiki users across domain rate perceived usefulness of Wikipedia.
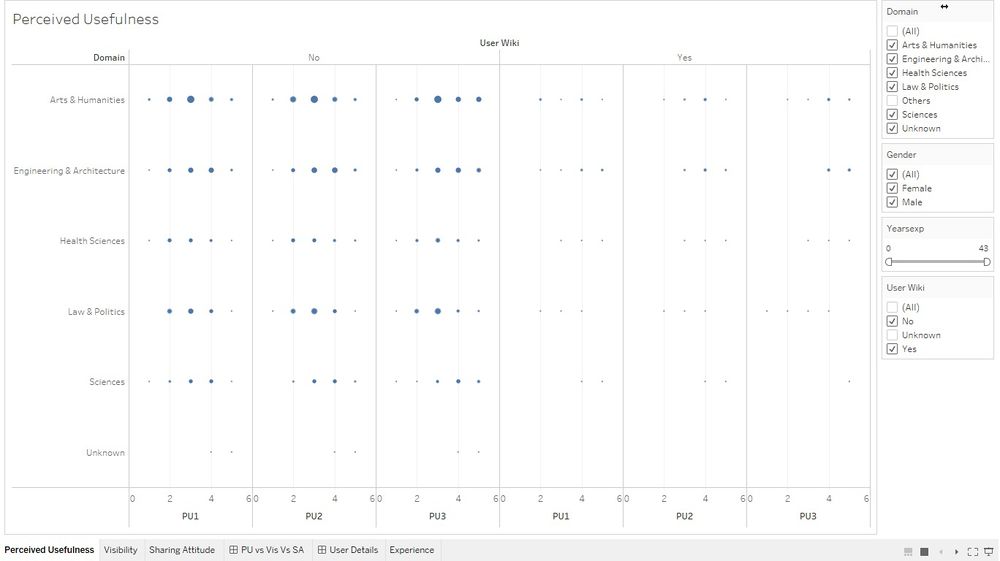
Using the interactive data analysis techniques, there are some interesting facts obtained for the perceived usefulness of Wikipedia among the users. Firstly, analyzing the response of registered users PU1 – The use of Wikipedia makes it easier for students to develop new skills • Majority of the respondents across all domains rate this as 4 (agree). • The notable observation though is that the respondents from domain, Arts & Humanities and Engineering & Architecture tend to use Wikipedia more compared to other 3 domains. • Even though majority of the respondents from Arts & Humanities tend to agree and strongly agree that Use of Wikipedia helps students to develop new skills, there is a significant percentage of users (27%) who disagree on this fact. • Engineering & Architecture domain users have a high tilt towards agreement to this fact. • Thus one of the deduction that can be made out of these observations is that the new skills that are developed while the use of Wikipedia are more relevant to Engineering & Arch domain compared to the Arts & Humanities domain. PU2 – The use of Wikipedia improves students' learning • Similar to PU1, majority of the users agree on this question. • Compared to PU1, the users tend to agree on the point that using Wikipedia improves students’ learning more than the students developing new skills. PU3 – Wikipedia is useful for teaching
- Most of the respondents agree on this point and it seems that majority of the users of Wikipedia use it for teaching purposes.
Now analyzing the response of Non-registered users PU1 – The use of Wikipedia makes it easier for students to develop new skills
- Majority of the respondents across all domains rate this as 3 (neutral).
- After studying the response on agreement and disagreement, larger number still disagrees for this fact.
PU2 – The use of Wikipedia improves students' learning
- Similar to PU1, majority of the users are neutral on this question.
PU3 – Wikipedia is useful for teaching
- The respondents are divided on this point too. Though majority are neutral, the respondents do not agree strongly for the usefulness of Wikipedia for teaching.
How do users across domain and age group rate Visibility of Wikipedia.
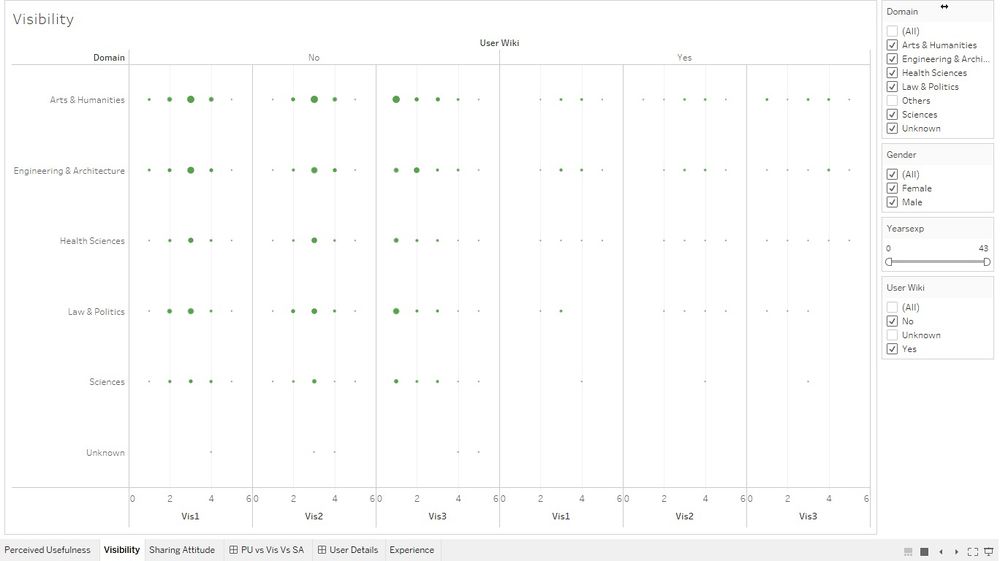
Using the interactive data analysis techniques, there are some interesting facts obtained for the Visibility of Wikipedia among the users. Firstly, analyzing the response of registered users Vis1 – Wikipedia improves visibility of students' work
- Majority of the chunk remain neutral on this question.
- Again Arts & humanities and Engineering & Arch tend to use Wikipedia more compared to other domains.
Vis2 – It is easy to have a record of the contributions made in Wikipedia
- Majority of the users again are neutral on this question.
- This analysis might deduce that even though the users promote the use of Wikipedia for educational purposes, they do not imply that it is easy to make contributions in Wikipedia.
Vis3 – I cite Wikipedia in my academic papers
- A very less number of users agree on this point. Most of the users are neutral which means that this functionality is less in use.
Now analyzing the response of Non-registered users Vis1 – Wikipedia improves visibility of students' work
- Majority of the respondents across all domains rate this as 3 (neutral).
Vis2 – It is easy to have a record of the contributions made in Wikipedia
- Similar to Vis1, majority of the users are neutral on this question.
Vis3 – I cite Wikipedia in my academic papers
- The respondents strongly disagree this point.
- This deduces that the Wikipedia is less popular for research work for academic papers.
How comfortable are the users with Sharing their work on Wikipedia.
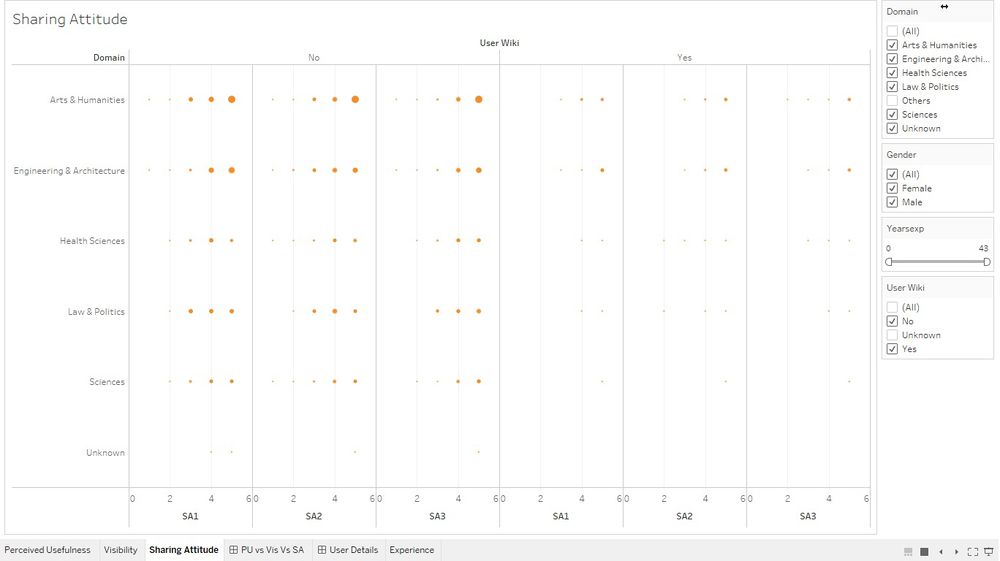
Using the interactive data analysis techniques, there are some interesting facts obtained for the Visibility of Wikipedia among the users. Firstly, analyzing the response of registered users SA1 – It is important to share academic content in open platforms
- Majority of the chunk strongly agree to this question.
- This provides an important point that the respondents understand the importance of sharing the academic content on the open platform which can benefit a huge number of student base and encourage to advance in the studies.
SA2 – It is important to publish research results in other media than academic journals or books
- The Users support this question by strongly agreeing.
- This shows that the publishing research results in media helps students to conveniently carry on their research and find the necessary resources easily.
SA3 – It is important that students become familiar with online collaborative environments
- The Users also strongly agree on this point.
- This might be the strongest point which might prompt the teachers to encourage their students to use Wikipedia as a prominent source for studies.
Now analyzing the response of Non-registered users SA1 – It is important to share academic content in open platforms
- Majority of the chunk strongly agree to this question.
SA2 – It is important to publish research results in other media than academic journals or books
- Majority of the chunk strongly agree to this question.
SA3 – It is important that students become familiar with online collaborative environments
- Majority of the chunk strongly agree to this question.
These opinions by the non-registered users show that they too believe that the content should be available online for sharing and understand that the online resources can be handy for research work.
How does Experience of the users matter in the investigation.
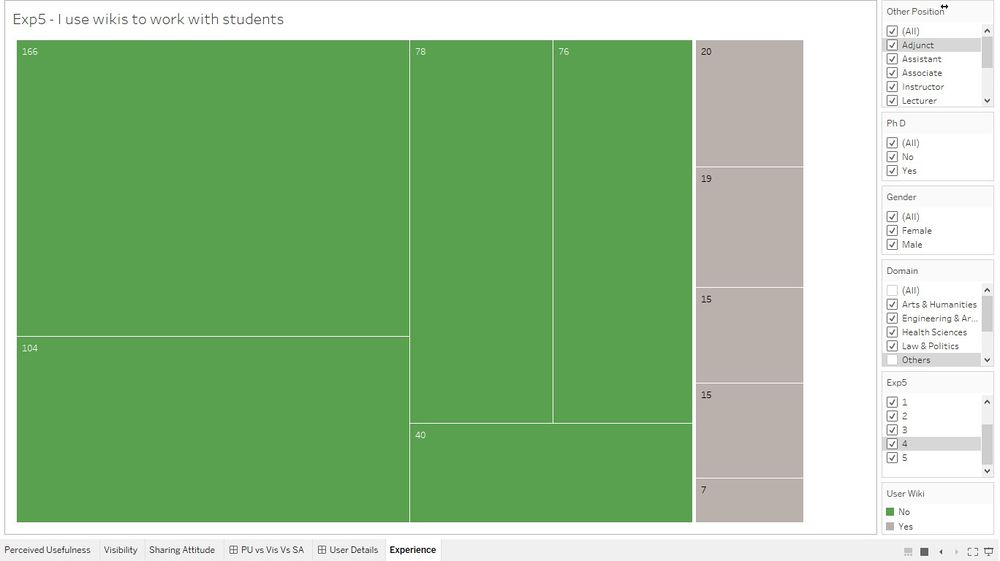
Experience can be vast in investigation. So taking one specific example for understanding the pattern of the users. EXP5: I use wikis to work with my students Following points can be noted from the analysis of the interactive tree map.
- Looking at the tree plot, we observe that in the registered users, maximum users agree to use wiki to work with their students.
- This shows that the users are comfortable using the Wiki resource and help integrate it in the study environment with the students.
- Whereas there is a very small number of non-registered respondents that use wiki to work with their students. Almost 51% from the total respondents disagree to use wiki to work with their students.
How do users across domains rate Wikipedia in terms of the quality.
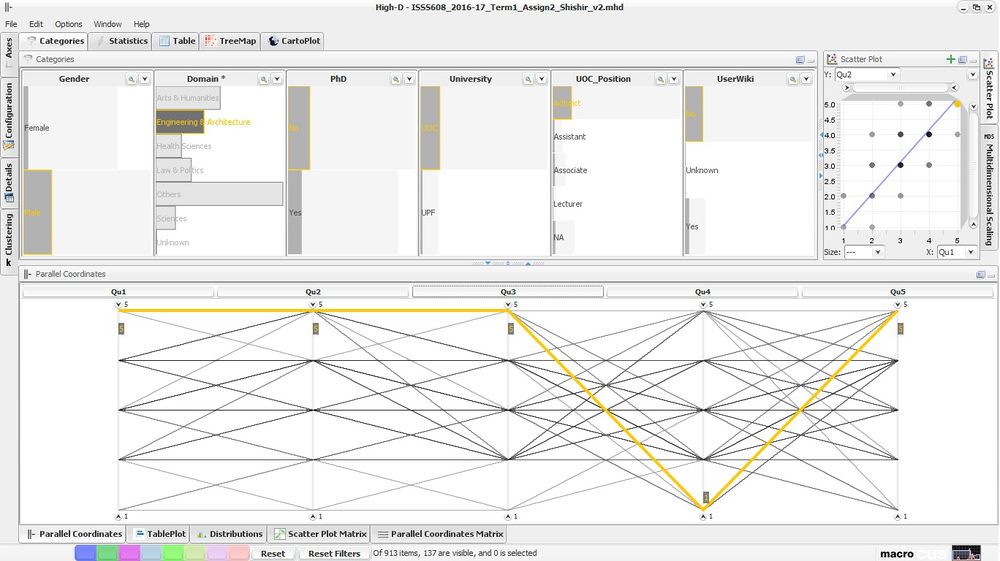
The questions to analyze Quality parameter are:
QU1 – Articles in Wikipedia are reliable.
QU2 – Articles in Wikipedia are updated.
QU3 – Articles in Wikipedia are comprehensive.
QU4 – In my area of expertise, Wikipedia has a lower quality than other educational resources.
QU5 – I trust in the editing system of Wikipedia.
As seen in parallel coordinates, following insights can be obtained.
- As highlighted in the image below, this pattern is observed for multiple cases where the users across the domain have agreed on the reliability, updates, comprehensiveness of the articles and editing system of Wikipedia.
- The notable point is their response on question 4 which is, lower quality of articles in their areas of expertise.
- Though, the Domain Art & Humanities differ from this group as the quality of articles is voted better as compared to the availability of articles in other area of expertise.
Citations
Meseguer, A., Aibar, E., Lladós, J., Minguillón, J., Lerga, M. (2015). “Factors that influence the teaching use of Wikipedia in Higher Educationâ€. JASIST, Journal of the Association for Information Science and Technology. ISSN: 2330-1635. doi: 10.1002/asi.23488.
Comments
