ISSS608 2016-17 T1 Assign2 Lee Gwo Mey
Contents
Abstract
- The purpose of this assignment is to apply interactive data exploration and analysis techniques to discover patterns from survey results on the use of Wikipedia as a teaching resource.
- From the data exploration, I found that
- Respondents with lower acceptance level to adopt use of Wikipedia are currently non-wiki users and who are either Adjunct, Assistant, Associate or Lecturer.
- Quality of Wikipedia could be a major concern that affect respondents' decision to use it as a teaching resource.
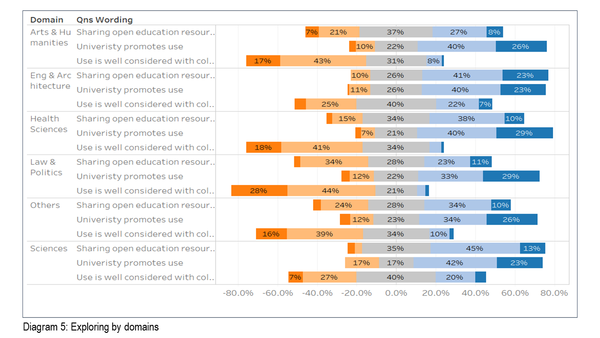
- Overall, the external environment is conducive in encouraging the use of Wikipedia except in 3 domains where the use is not so well considered among colleagues. The 3 domains are Arts & Humanities, Health Sciences, and Law & Politics.
- URL link to the web-based interactive data visualization dashboard is found in
https://public.tableau.com/profile/gwomey#!/vizhome/ISSS608_Assign02_Likert_LGM_5/Dashboard1
Data Sets
- wiki4HE Data Set (https://archive.ics.uci.edu/ml/datasets/wiki4HE)
Interactive Data Exploration and Analysis Technique
- Data visualization software tool - Tableau
- Visual analytics techniques - Divergent bar chart
Visual Analytics Application Design Process
Step 1: Identify a Theme of Interest
Exploratory study on the motivation and barriers behind University faculty members' use of Wikipedia as a teaching resource.
Step 2: Define Questions for Investigation
Motivation factors and barriers that contribute to the use of Wikipedia could be broadly classified under (i) perceptions and attitude, (ii) current usage, and (iii) external environment. Initial questions designed to discover these factors are:
- What is the general attitude and acceptance level of University faculty members on the use of Wikipedia?
- Does the quality of Wikipedia affect University faculty members' decision to use it?
- Is there a relationship between the University environment and the faculty members' attitude to use Wikipedia?
Step 3: Find the Appropriate Data Attributes
- The wiki4HE data set consists of survey responses from 913 faculty members from 2 Spanish Universities (UOC and UPF).
- The survey comprises 43 Likert-scaled questions to assess respondents' agreement to each question.
- The following survey questions and their responses are selected to review if these can provide insights to the investigation questions in step 2 above.
| S/N | Qns Ref | Category | Qns |
|---|---|---|---|
| 1 | BI2 | Behavioural Intention | In future, I will use Wikipedia in my teaching activity |
| 2 | EXP1 | Experience | I consult Wikipedia for issues related to my field of expertise |
| 3 | JR1 | Job Relevance | My university promotes the use of open collaborative environments in the Internet |
| 4 | PEU1 | Perceived Ease of Use | Wikipedia is user-friendly |
| 5 | PU3 | Perceived Usefulness | Wikipedia is useful for teaching |
| 6 | QU1 | Quality | Articles in Wikipedia are reliable |
| 7 | IM2 | Social Image | In academia, sharing open educational resources is appreciated |
Constructing the Visualization
Data Preparation & Transformation
- Import raw data file (wiki4HE.csv) into MS Excel
- Create a unique "Respondent_ID" for each survey respondent
- Split the data file into 3 separate MS Excel worksheet tab
- Demographic - convert the response code (e.g. gender "0") to text (e.g. "Male")
- Question - include for each question ID, the question category (e.g. "perceived usefulness") and a brief question text (e.g. "wiki is useful")
- Response - include responses in both numeric format (e.g. "3") and text format (e.g. "neutral")
- Null values - replaced the "?" (questions not answered) with blank fields
- Liker Scale - label each scale as follows:
- 1-Strongly Disagree
- 2-Disagree
- 3-Neutral
- 4-Agree
- 5-Strongly Agree
- Reshape data - current survey response format is in a one-row-per-respondent and one-column-per-question table. Tableau add-in for MS Excel is used to reshape the format into a one-column format for all responses.
- Although I am focusing my data discovery on the 10 survey questions above. I will still import all 43 survey questions into Tableau. This provides me the flexibility to interact with the data set and refine my questions during the exploratory phase.
Divergent Bar Chart2
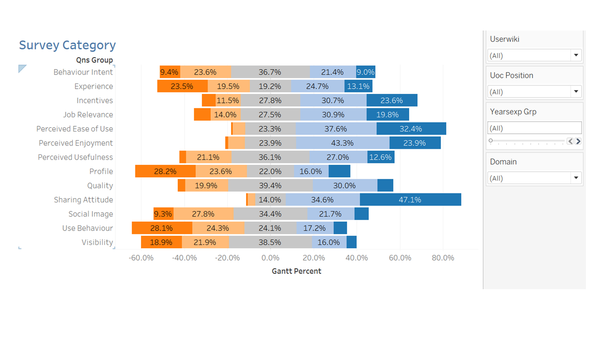
- The divergent bar chart is my chosen visualization technique as it best present the negative, neutral and positive sentiments in each bar relative to each question.
- 6 calculated fields are created for the divergent bar chart.
- Count Negative IF[Numeric Response]<3 THEN 1 ELSE IF [Numeric Response]=3 THEN 0.5 ELSE 0 END
- Total Count Negative TOTAL(SUM([Count Negative]))
- Total Count TOTAL(SUM([Number of Records]))
- Gantt Start -[Total Count Negative]/[Total Count]
- Percentage SUM([Number of Records])/[Total Count]
- Gantt Percent PREVIOUS_VALUE([Gantt Start])+ZN(LOOKUP([Percentage],-1))
Intermediate Visualization
Evolution 1
General Attitude and Acceptance Level
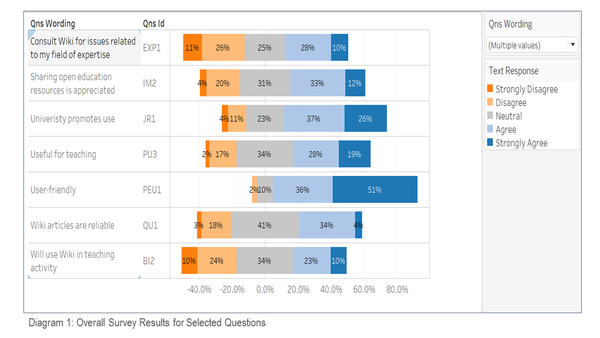
- Although there is high positive attitude towards Wikipedia's ease of use and its usefulness for teaching, the acceptance level to adopt Wikipedia is still lagging behind with only one-third of respondents planning to use Wikipedia for teaching in future.
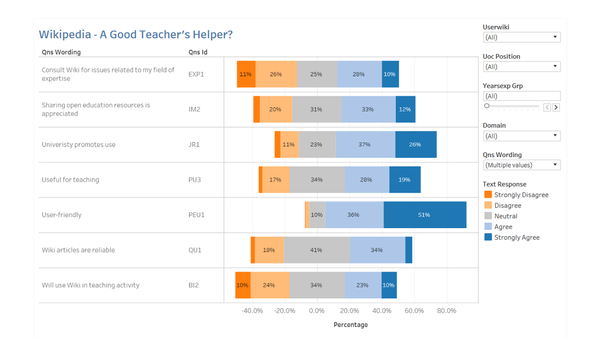
- From diagram 1, 87% of respondents perceived Wikipedia as user-friendly (PEU1) and 47% perceived it to be useful for teaching (PU3). However, only 33% plan to use Wikipedia in their teaching activity in future (BI2).
- I will further explore the data set to find out whether there are any differences in respondents' characteristics between those who plan and those who do not plan to use Wikipedia. I will drill further to look at the existing use of Wikipedia and the academic positions of the respondents.
Quality of Wikipedia
- From diagram 1, only a mere 38% of respondents viewed that articles in Wikipedia are reliable (QU1) and 38% consult Wikipedia for issues related to their field of expertise (EXP1). To further find out if quality of Wikipedia is a major concern, I will look at all the survey results under the "quality" category and whether the number of years of teaching experience will affect the respondents' perception on the quality of Wikipedia.
External Environment
- The external environment is conducive in encouraging the use of Wikipedia. From diagram 1, 63% of respondents agreed that their Universities promote the use of open collaborative environments in the Internet (JR1) and 45% agreed that sharing open educational resources is appreciated in academia (IM2).
Evolution 2
General Attitude and Acceptance Level
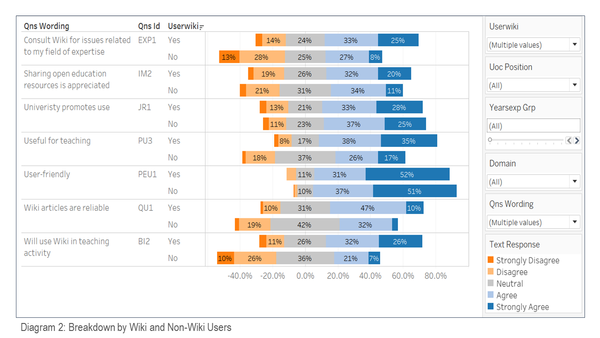
- Filtering by respondents who are wiki and non-wiki users (diagram 2), it become apparent that non-wiki users have a higher negative perception on the usefulness (18%) and quality (19%) of Wikipedia than respondents who are wiki-user. It is also not surprising that 41% of non-wiki users do not consult Wikipedia for work-related issues and 36% are not planning to use Wikipedia in teaching activity.
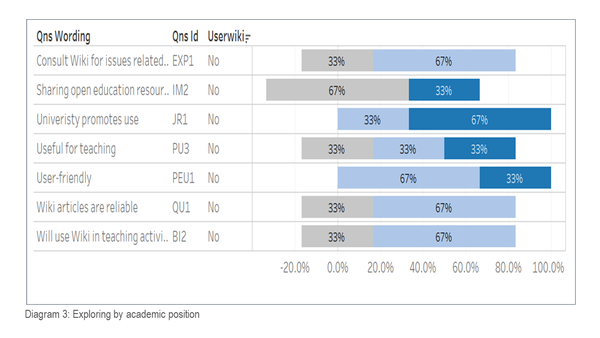
- Filtering by the academic position (diagram 3), I found that for non-wiki users who are Professor or Instructor, they have a more positive attitude and plan to use Wikipedia in their teaching activities. Respondents with lower acceptance level to adopt the use of Wikipedia are current non-wiki users and who are either Adjunct, Assistant, Associate or Lecturer.
Quality of Wikipedia
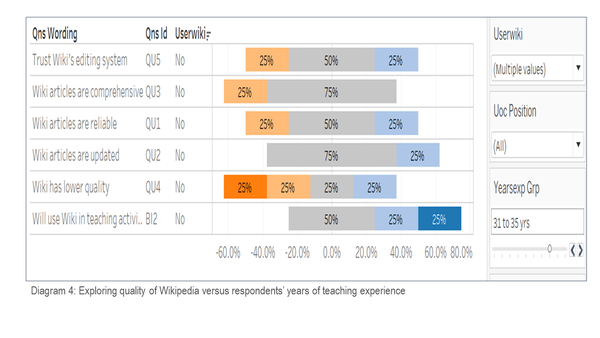
- I selected all the survey questions pertaining to quality of Wikipedia and interactively look for any obvious changes in the survey results by changing the "years experience" value (diagram 4). I observed that for respondents within the "31 to 35 years" category, they are all non-wiki users and while 25% of them have reservations on the quality of Wikipedia, half of them will plan to use Wikipedia and the other half remain neutral. None were adverse in adopting Wikipedia as teaching resource. However, it should be noted that there are only 4 respondents under the "31 to 35 years" category. Therefore, quality of Wikipedia remains a concern for respondents when deciding to use Wikipedia for teaching.
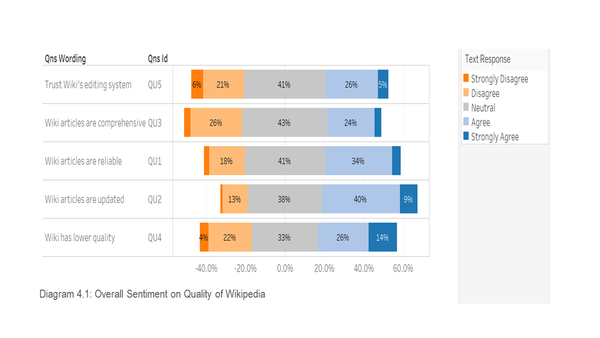
- Diagram 4.1 shows the overall sentiments on the quality of Wikipedia by all respondents. I observed that for all 5 survey questions, question ID QU4 ("In my area of expertise, Wikipedia has a lower quality than other educational resources) is worded differently from the other 4 survey questions. For respondents who selected "Strongly Agree" or "Agree" to QU4, this indicates that the respondents felt that Wikipedia has lower quality. Whereas for respondents who selected "Strongly Agree" or "Agree" to the other 4 survey questions (QU1, QU2, QU3 and QU5), this indicates that the respondents felt positive towards the quality of Wikipedia. Therefore, when interpreting QU4, I am mindful to note that 40% agreed that Wikipedia has lower quality and 26% felt that Wikipedia has better quality.
External Environment
- Overall, the external environment is conducive with 63% of respondents agreeing that their Universities promote the use of open collaborative environments in the Internet. I further explored if this culture is the same across all domains. From diagram 5, it is observed that the use of Wikipedia are not so well considered in 3 domains (Arts & Humanities, Health Sciences, and Law & Politics).
Final Visualization
References: [1] Meseguer, A., Aibar, E., Lladós, J., Minguillón, J., Lerga, M. (2015). Factors that influence the teaching use of Wikipedia in Higher Education. JASIST, Journal of the Association for Information Science and Technology. ISSN: 2330-1635. doi: 10.1002/asi.23488. [2] http://www.datarevelations.com/likert-scales-the-final-word.html
