ISSS608 2016-17 T1 Assign2 Ho Li Chin
Contents
- 1 Abstract
- 2 Theme of Interest
- 3 Examine the Survey Questions
- 4 Questions for Investigation
- 5 Analysis of Wiki For Higher Education Dataset through Visualisation
- 6 Tools Used and Visualisation Links
- 7 Conclusion
Abstract
In this assignment, the interactive data exploration and the analysis techniques will be applied to discovery patterns in multivariate data.
Theme of Interest
In this assignment, the dataset that have been chosen for the analysis is “wiki4HE Data Set” (https://archive.ics.uci.edu/ml/datasets/wiki4HE).
The theme of interest is to explore the factors affecting the use of Wikipedia in Higher Education. Wiki technology emerged in higher education teaching and learning experiences as early as 1999 and is integrated into many courses for its ability to provide a collaborative environment for Academic staff and students.
The objective of this assignment is to understand the main factors that influence the teaching uses of Wikipedia among university faculty staff, and any of those factors have significant direct impact on the Behavioral Intention of adopting Wikipedia in higher education, for providing more effective and efficient methods to maximize the teaching and learning experience.
Examine the Survey Questions
In this section, we will first examine the survey questions in the dataset. The survey questions are categorized into respective broader category, and each category is mapped to one construct measure for investigation purpose. These measures will be considered to further derive the investigation questions in next section, for the purpose of the analysis.
| Survey Question Category | Survey Questions (Variables) | Measures |
|---|---|---|
| Perceived Usefulness |
PU1: The use of Wikipedia makes it easier for students to develop new skills |
User perception of technological innovations using wiki technology |
| Perceived Ease of Use |
PEU1: Wikipedia is user friendly |
User perception of technological innovations using wiki technology |
| Perceived Enjoyment |
ENJ1: The use of Wikipedia stimulates curiosity |
User perception of technological innovations using wiki technology |
| Use behavior |
USE1: I use Wikipedia to develop my teaching materials |
Motivation to use wiki |
| Experience |
EXP1: I consult Wikipedia for issues related to my field of expertise |
Motivation to use wiki |
| Job relevance |
JR1: My university promotes the use of open collaborative environments in the Internet |
Motivation to use wiki |
| Sharing attitude |
SA1: It is important to share academic content in open platforms |
Collaborative Mindset / Attitude |
| Profile 2.0 |
PF1: I contribute to blogs |
Collaborative Mindset / Attitude |
| Quality |
QU1: Articles in Wikipedia are reliable |
Perceived quality of wiki information |
| Social Image |
IM1: The use of Wikipedia is well considered among colleagues |
Social Influence |
| Visibility |
VIS1: Wikipedia improves visibility of students' work |
Social Influence |
| Behavioral intention |
BI1: In the future I will recommend the use of Wikipedia to my colleagues and students |
Intention to use wiki |
Questions for Investigation
From the construct measures as defined in Section 3, the followings are the evolved list of questions for investigation. Different visualizations will be constructed to present the data and to answer the questions.
List of questions for investigation:
- a) Relationship between the different factors that could influence the uses of Wikipedia among university faculty.
- What are the positive factors and the negative influence factors?
- b) What are the likely factors that negatively influence the Behavior Intention to adopt Wikipedia
- Any identification of attributes (e.g. age, academic position, current wiki user etc) that result in the negative Behavior intention to use Wiki
- Any skeptical attitudes in university faculty regards using Wikipedia in class
- Any identification of attributes (e.g. age, academic position, current wiki user etc) that result in the negative Behavior intention to use Wiki
   The two questions regarding the Behavior Intention in the survey were:
   BI1: In the future I will recommend the use of Wikipedia to my colleagues and students
   BI2: In the future I will use Wikipedia in my teaching activity
- c) Understanding of some measures as listed below, that could influence the Behavior Intention to use Wikipedia
- User perception of technological innovations using wiki technology
- Motivation factors to use Wikipedia
- Social Influence
- Perceived quality of information using wiki
Analysis of Wiki For Higher Education Dataset through Visualisation
Data Source
The data source for the Wiki dataset can be obtained from
- UCI dataset [[1]]
Data Preparation
The Data preparation is mainly done with JMP, the steps can be summarised as follow:
- Load the wik4HE.csv file into JMP
- Examine the attribute data types
- Convert the data types of some attributes from Numeric to Categorical
- Recode the values for some categorical attributes. E.g. For Gender, recoded as "Male" and "Female"
- Missing data pattern check
- For categorical variables such as Domain, UOC_Position, the missing values were recoded as "Unknown"
- For Survey Scale values, the missing values were recoded as "Don't Know" response.
Data Cleansing & Transformation
The data transformation was done in JMP in few iterations.
- First, summary and distribution analysis were done for the categorical (univariate) variables.
- Then, for those continuous survey scale response, the multivariate analysis was done to examine the relationship between the variables. Pair-wise correlation, Trenary, Parallel Plot were carried out for this data exploration.
- In order to prepare the dataset for Likert Scale analysis for the survey based questions, all the survey questions variables were stacked using JMP Stacked function to stack all the columns into rows under two columns, namely "Survey Qns" and "Scale".
- One new column was created to recode the Scale to Categorical type with the followings types.
  Likert Scales - label each scale as follows:

  1-Strongly Disagree, 2-Disagree, 3-Neutral, 4-Agree, 5-Strongly Agree
For those missing value, the type is recoded as "Don't Know"
- Lastly, the cleaned data file is imported to Tableau and Qlik Sense for further analysis through data Visualisation.
Visualisation to Answer the Questions under investigation
Demographics Profiles of the University Faculty Staff
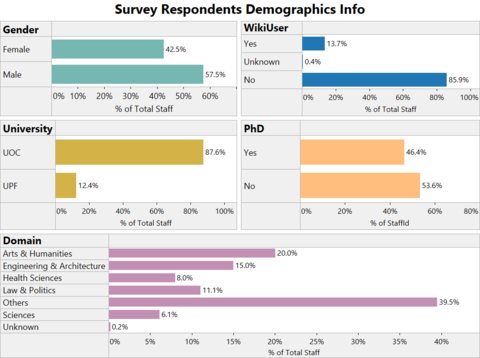
First, before we analyse on the survey variables that could affect the adoption behavior of Wikipedia among the University staff, let’s take a look on the demographics information of University faculty staff participated in this survey.
Dashboard #1 Demographics Info [[2]] (click here)
Visualisation Design
The above Tableau dashboard provides an interactive way to allow user to use Gender & WikiUser as Filtering options to select the info on University, PhD and Domain details.
Findings
In summary, there are a total of 913 University faculty staff participated in the survey. Some key demographics profile of the staff are:
- More male staff (57.5%) than female staff (42.5%)
- About 86% of the staff are NonWiki user
- About 88% of staff were from UOC University, and out of this, 56.6% have PhD qualifications.
- For all staff, besides Others (which is the highest percentage), 20% of staff were from Arts & Humanities domain, followed by 15% from Engineering & Sciences, and 11% from Law & Politics.
Staff Profile Dashboard
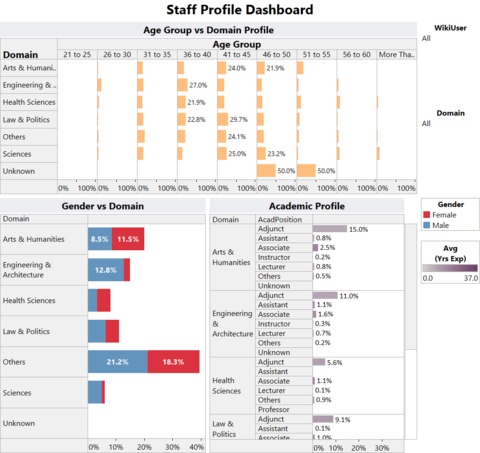
The following Tableau dashboard provides an interactive visualisation to further drill down to more details profile information in terms of Age Group by each Domain, Gender % for each domain, and also the academic position profile for each domain area.
Dashboard #2 Staff Profile Dashboard [[3]]
Findings
- For all domains, Adjunct staff attributed to the highest academic profile for the faculty staff
- From the Age Group vs Domain profile, for almost all domains, the main age groups of staff were in the range of 41 to 45, followed by 36 to 40. They were the middle age from 36 to 45.
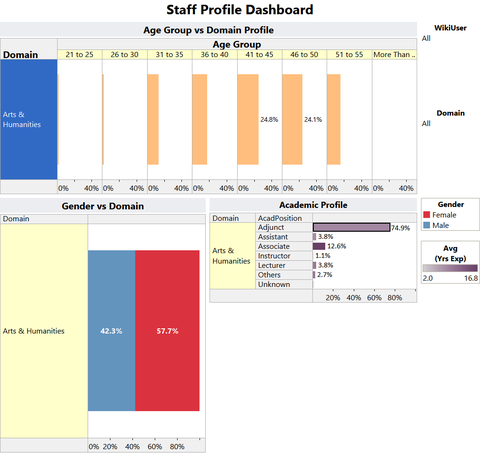
- We further drill down to Arts & Humanities faculty, it’s observed a high percentage of staff of 75% were Adjunct staff, out of this 57.7% were female staff, and about 50% of the Adjunct in age range 41- 50.
The Various Factors that Influence the Use of Wikipedia
Next, we will analyse at a macro level all the various factors that could influence the adoption of Wikipedia among the University staff.
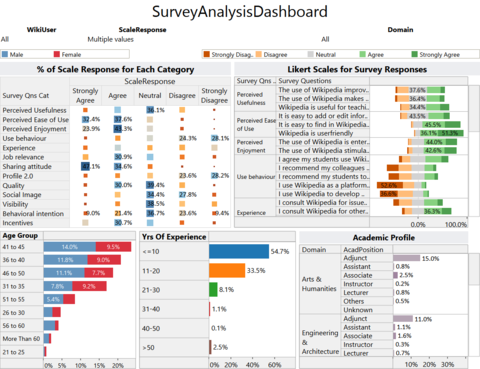
The following Tableau dashboard provides an interactive visualisation to examine the positive and negative factors that would affect the use of Wikipedia among the University staff in Higher Education .
Dashboard #3 Survey Analysis Dashboard [[4]] (Click here)
Visualisation Design
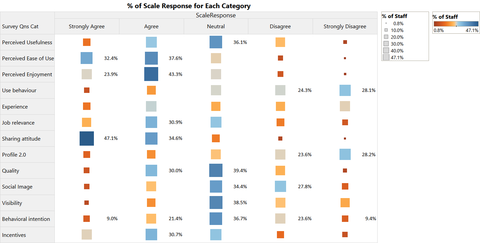
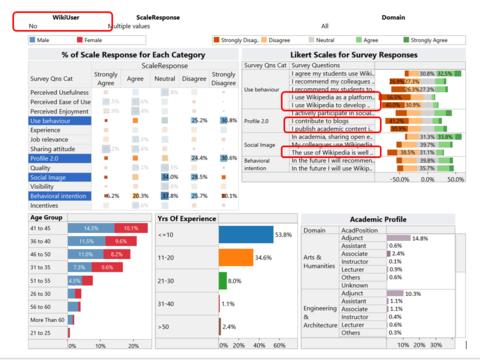
The above Tableau dashboard consists of a Heat Map that visualize the % of survey response scale for each survey category. Note that the % calculation is computed as % of Total across each category, that means the total % for each category should add up to 100%. In this case, we are able to identify the positive and negative factors (variables) that influence the behavior intention to use Wikipedia.
Upon selecting any of the categories in Heat Map, it provides the interactivity to allow user to drill down on the divergent bar chart on the right quadrant to look at the Likert scales for the response each survey question.
This dashboard will allow the user to examine the “What are the positive and negative influence factors that could affect the uses of Wikipedia among university faculty”
In addition, the Age Group, Academic Profile and Years of Experience were included at the bottom quadrant so that we can further examine what could be the likely factors that negatively influence the Behavior Intention to adopt Wikipedia, and if there is any identification of attributes (e.g. age, academic position, current wiki user etc.) that result in the negative Behavior Intention to use Wiki?
Findings
To answer the Investigation (a) on “What are the positive factors and the negative influence factors?”
- 1) Positive factors (in terms of high response % of Strongly Agree + Agree) are:
Sharing Attitude (80.6%), Perceived Ease of Use (67%), Perceived Enjoyment (66.2%)
- 2) Poor (negative) factors (in terms of high response % of Disagree + Strongly Disagree) are:
Use Behavior (51.5%) and Profile 2.0 (51.3%)
- 3) It’s also observed that some of the survey questions category have responses with more than 30% of Neutral responses, they are
Perceived Usefulness, Quality, Social Image, Visibility, and Behavioral Intention
To answer the Investigation (b) on “What are the likely factors that negatively influence the Behavior Intention to adopt Wikipedia”
From the Heat Map on % of Scale Response for Each Category, it’s observed that 30.4% indicated positive response (SA + A), 34% indicated negative responses (D + SD), and 36.7% stayed neutral opinion for Behavior Intention.
Next, we will compare the Wiki users vs Non-Wiki usersItalic text, to see if any patterns in their positive and negative responses for Behavior Intention to adopt Wiki.
Wiki Users
Findings
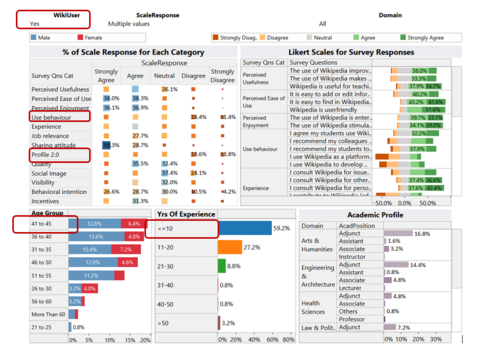
- For Wiki Users, they were largely have less than 10 years of work experience, and in the age group of 41 to 45. Most of the staff in this group were the Adjunct staff for all domain areas.
- Almost 55% of the Wiki users were positive about the Behavior Intention to use Wikipedia, 30% indicated Neutral, and about 15% indicated D+SD.
- They were generally very positive in Perceived Ease of Use, Perceived Enjoyment and Sharing Attitude.
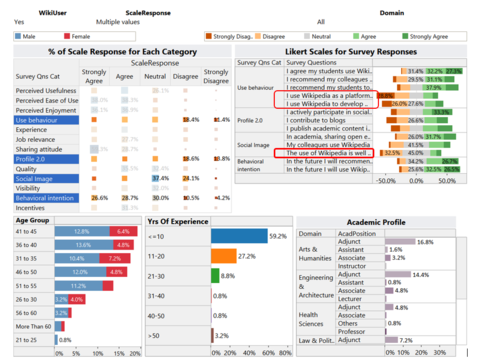
- On the other hand (as shown in the visualisation below), Use Behavior and Profile 2.0 scored poorer in terms of % response of D + SD.
- The survey questions that fared with high % of D + SD responses were
- I use Wikipedia as a platform to develop educational activities with students
- I use Wikipedia to develop my teaching materials
- I contribute to blogs
- The use of Wikipedia is well considered among colleagues
Non-Wiki Users
Findings
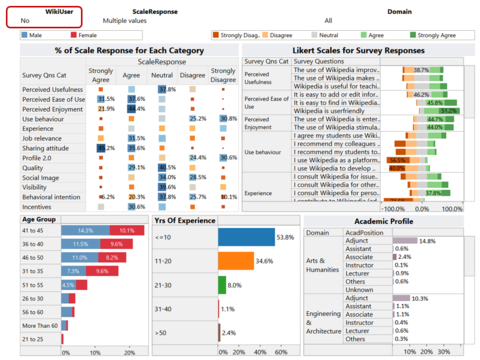
- For Non Wiki Users, similar to Wiki users, they were largely have less than 10 years of work experience, and in the age group of 41 to 45. Most of the staff in this group were the Adjunct staff for all domain areas.
- It’s observed that nonWiki users seems to have more Neutral response in most survey categories as compared to Wiki user.
- Non-Wiki users were more negative for Behavior Intention (about 36% of D+ SD as compared to Wiki users at 15%). Less than 30% indicated A+SA, and about 38% indicated Neutral.
- Similar to Wiki users, they were generally more positive in Perceived Ease of Use, Perceived Enjoyment and Sharing Attitude.
- On the other hand, as shown in the visualisation below, Use Behavior, Profile 2.0 and Social Image scored poorer in terms of % response of D + SD.
- The survey questions that fared with high % of D + SD responses were
- I use Wikipedia as a platform to develop educational activities with students
- I use Wikipedia to develop my teaching materials
- I contribute to blogs
- The use of Wikipedia is well considered among colleagues
- I publish academic content in open platforms
The Key Factors that Negatively Influence the Behavior Intention to adopt Wikipedia
The two survey questions for BI are:
- BI1: In the future I will recommend the use of Wikipedia to my colleagues and students
- BI2: In the future I will use Wikipedia in my teaching activity
Here, we use JMP to do the Pairwise Correlation for the multivariate analysis. In particular, we are keen to identify the factors (variables) which are highly correlated to Behavioral Intention.
From the above, the variables which are highly correlated to Behavioral Intention are
- Use Behavior, Experience, Visibility, Quality and Social Image
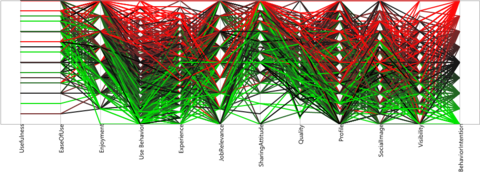
Next, now a Parallel Plot will be used to ascertain the above are the key factors that are worth to investigate in details.
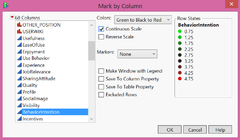
The plot was marked with the color marker on the Behavior Intention as shown below.
From the Parallel Plot above, it's noticeably observed that the bright green markers are cluttered at lower range for Use Behavior, Experience and Visibility. We will therefore further examine into the following measures in next section for further investigate.
- Motivation to use wiki (Use Bahavior, Experience)
- Social Influence (Social Image, Visibility)
- Perceived Quality (Quality)
Investigation on key factors
Now, we will further investigate on the key measures which were identified in the above section.
- Motivation factors to use Wikipedia (Use Behavior, Experience)
- Social Influence (Social Image, Visibility)
- Perceived quality of information using wiki (Quality)
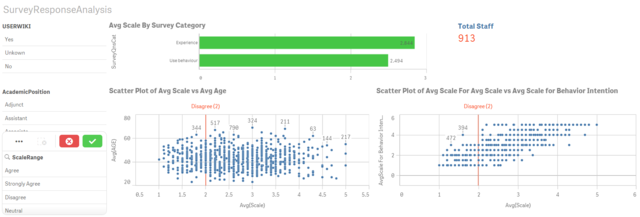
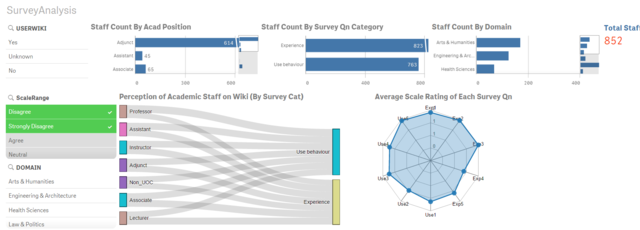
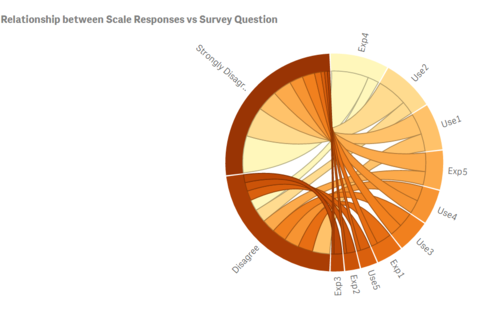
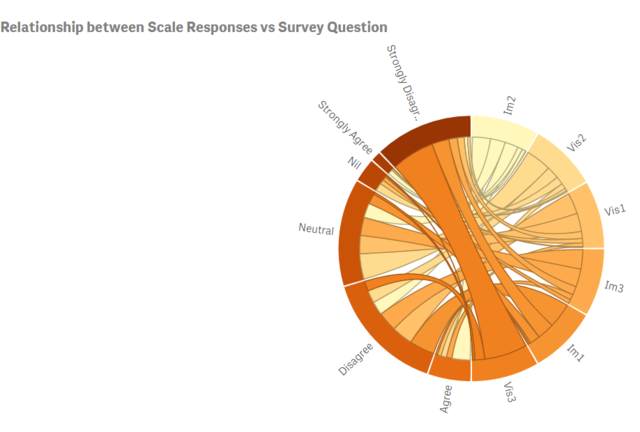
A Qlik Sense App has been created to provide an interactive visualisation to drill down into the relationship between various attributes (age, academic position, domain, current wiki users, survey questions) regards to the positive and negative response in each measure. The types of visualisation objects used in Qlik Sense app include Radar Chart, Dependency Wheel, Bar Charts, Sankey Diagram.
Qlik Sense App [[5]] (click here)
Youtube [[6]] (click here)
Visualisation design
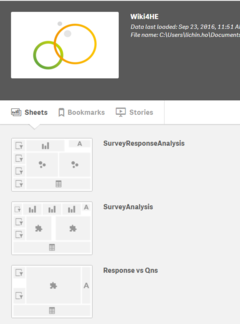
There are three dashboards in the Qlik Sense App. The purpose of these dashboards are to uncover some of the following insights:
- Any identification of attributes (e.g. age, academic position, current wiki user etc) that could influence the staff behavior intention to use wiki
- Detect any skeptical attitudes among university faculty regards using Wikipedia in class
- Establish any relation to disciplinary factors (e.g. academic position or domain area) or any implicit conflict between the scientific academic culture and Wikipedia culture.
Findings
Over here, we will focus only on discussion based on findings in 3 areas, namely the motivation factors to use wiki, the social influence, and lastly the perceived quality of wiki information.
- .a) Motivation Factors to adopt Wiki (Use Behavior, Experience)
From the Survey Response Dashboard, first we filter only the 2 Survey Categories namely Use Behavior and Experience as shown below. All the chart visualizations are now associated to the filtered data based on the above selection.
Next, we would like to identify some attributes observed from Disagree and Strongly Disagree (D + SD) response group.
The above two visualisations provided some insights to the followings
Note: The % in bracket means the % of all staff indicated A+SA in survey questions regards to Motivation
- For the "Poor in Motivation" response (Disagree + Strongly Disagree)
- Survey questions with high number of (Disagree + Strongly Disagree) responses are:
- EXP4 (17.6%): I contribute to Wikipedia (editions, revisions, articles improvement...)
- USE2 (15.8%): I use Wikipedia as a platform to develop educational activities with students
- USE1 (14.0%): I use Wikipedia to develop my teaching materials
- For the "Good Motivation" was contributed by Experience, followed by Use Behavior
- Survey questions with high number of (Agree + Strongly Agree) responses are:
- EXP3 (20.4%): I consult Wikipedia for personal issues
- EXP2 (18.1%): I consult Wikipedia for other academic related issues
- USE5 (15.0%): I agree my students use Wikipedia in my courses
- Demographics
- The main group was from Adjunct.
- Mostly having years of experience of less than 20 yrs.
- b) Social Influence (Quality)
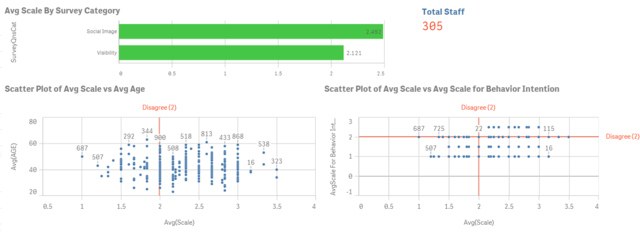
Using the same interactive techniques as described above, we will now examine the Influence of Social Influence to adopt Wiki.
Observations:-
- By selecting only those with average scale of Behavior Intention less than 2.0, it's observed that most of the response given in Social Image and Visibility cluttered around scale <2.50.
- The biggest contribution to low scale in Avg Scale in Behavior Intention are from Disagree (30.6%), Neutral (26.7%), and Strongly Disagree in Social Image and Visibility survey questions.
- c) Perceived quality of wiki information (Quality)
Lastly, the observations for perceived quality of Wiki Information are as follow:
- QU4 (26.6%): In my area of expertise, Wikipedia has a lower quality than other educational resources
- QU3 (21.9%): Articles in Wikipedia are comprehensive (25%)
- QU5(18.9%): I trust in the editing system of Wikipedia (22.6%)
Tools Used and Visualisation Links
Visualisation Toolskit:-
1) Tableau 10.0
2) JMP
3) Qlik Sense
The Visualisation links are as follow:-
1) Tableau
2) Qlik Sense
- Qlik Sense App [[10]]
- Youtube Link
Walk through of Qlik Sense App via Youtube [[11]]
3) JMP 12.2
4) Other tools used in the exploration
- Mondrian
- High-D from MacroFocus
Conclusion
When we have a dataset with high number of dimensions and several questions to be answered, we need to first identify the relevant parameters for each question. These types of analysis vary based on the nature of the data and the specific relationships that we want to discover and understand. There are different ways to visualise the multivariate data, each type of investigation can be most effectively pursued using particular types of visualizations and particular techniques for interacting with multivariate data. In this assignment, a few of the visualizations e.g. heatmaps, glyphs, parallel plot, divergent bar chart have been used to bring up the light of data.
