ISSS608 2016-17 T1 Assign2 Goh Kar Hock Raymond
The Initial Approach
Question Version 1: What is the correlation between share price and profit for the top 30 companies which gained the most in share price for the past 5 years (2010 – 2016)?
However I have drilled too in depth into individual company using JMP using only the graph builder, hence need to rethink my approach again towards the study.
The Restart
Question Revisited: 1. What is the relationship between the variables Revenues, Operating Expenses, Profit/Loss of the companies performed over the years?
2. What is the relationship between Assets, Liabilities, Retained Earning and Profit/Loss, which could allow an investor to understand a company abilities to repay all its’ liabilities? In addition, How could the past performance and yearly performance of the company allows an investor to make a judgement call on the potential of investing in the company.
Data Preparation
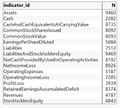
Load in the data into JMP. Then select “Data Filter” to select the required indicator out of 8529 indicators.
Indicators selected are shown in the figure below:
Go to the data source page and right click on “Selected”, then choose “Data View” as shown in the picture below. Remove 2016 data as there were more than 99% missing data.
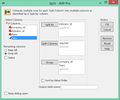
Save the selected data as “Ver2 16 Variables.jmp”. Stack the columns 2010 – 2015 then save the file as “Ver2 16 Variables Stacked Years.jmp”. Then Split the data as shown in figure below and save the file as “Ver2 16 Variables Stacked Years Split.csv”
Data Exploration
Load both files “Ver2 16 Variables Stacked Years Split.csv” and “companies.csv” into Tableau. Create a new “Year” field (See figure below) and start exploring.
Create first worksheet for comparing Profit/ Loss in Rows vs Expenses in Columns, with Company under colour and Sum(Revenues) under size. Create second worksheet to compare Operating Expenses in rows vs Revenues in columns, with Company under colours, measure values in size and measure names under shape. Create third worksheet to compare Liabilities in rows vs Assets in columns, with Company under colours and Retained Earning in size. Create fourth worksheet to compare Liabilities in rows vs Assets in columns, with Company under colours and Profit/Loss in size.
Put all the four worksheet into a dashboard for understanding of how the variables Revenues, Operating Expenses, Profit/Loss of the companies performed over the years. The worksheets on Assets, Liabilities, Retained Earning and Profit/Loss will allow an investor to understand a company abilities to repay all its’ liabilities. In addition, the worksheet also reflects the past performance and yearly performance of the company and make a judgement call on the potential of investing in the company.
Dashboard
Please refer to the link below for the interactive Tableau Dashboard.


