ISSS608 2016-17 T1 Assign2 Arcchit Mittal
Contents
Abstract
Wikipedia is the lone source for students to gather useful information for academic and non-academic purpose. In the following study, faculty from two Spanish universities were asked few question regarding Wiki and were asked to score it from 1 to 5. From this study the preferences of the faculty, whether Wiki is good for education or not, can be determined.
Introduction
This study is based on an ongoing research on university faculty perceptions and practices of using Wikipedia as a teaching resource. Faculties of UOC and UPF in Barcelona, Spain were asked few questions and score them on a Likert scale (1-5) ranging from strongly disagree / never (1) to strongly agree / always (5). The research team there used Technology Acceptance Model (TAM) to predict the “intention to use” and “acceptance of new information system”. Both the perception of colleagues, opinion about Wikipedia and the perceived quality of the information in Wikipedia play a central role in the obtained model.
Data used for above research will be used to create some interactive visualization using Tableau and discover some interesting patterns.
The Data
The data was downloaded from the UCI Repository, the dataset was made from a research on "Factors that influence the teaching use of Wikipedia in Higher Education" by E. Aibar, J. Lladós, A. Meseguer, J. Minguillón (jminguillona[at]uoc[dot]edu), M. Lerga. Universitat Oberta de Catalunya, Barcelona, Spain. The data set, Wiki4HE, was in.csv format and was first uploaded onto JMP Pro for some recoding and some new variables were added via excel.
Each person who responded was assigned with a unique ID. The variables in the dataset was compared to the data description for better understanding of the data. Using JMP Pro, the data was checked for missing values and Distribution to see the types of values captured in each column. It was noted that there were a number of “?” in some of the variables. For the purpose of this study, the “?” for the demographic details will be treated as “unknown” and "NA", depending on the variable, and for responses it will be treated as “null”.
The Wiki4HE dataset contained the followiings:
- 800 distinct responses from full-time and part-time professors from Universitat Oberta de Catalunya (UOC), Barcelona, Spain.
- 113 persons from Universitat Pompeu Fabra (UPF), Barcelona, Spain
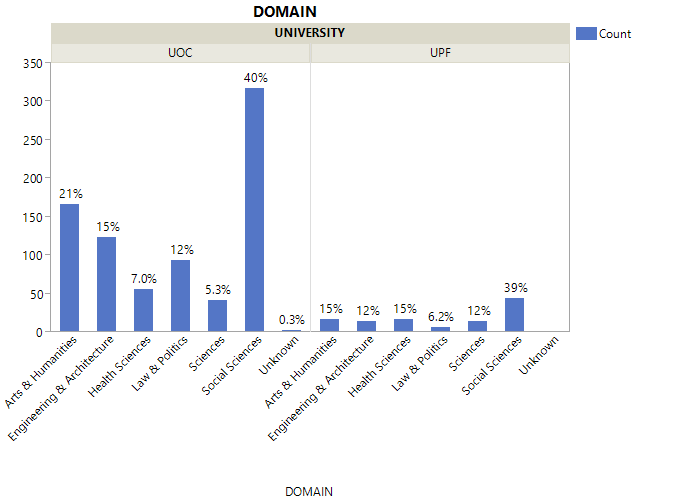
There were six domains used, and the breakdown by university is as follows:
UOC
- Arts and Humanities: 21%
- Engineering and Architecture: 15%
- Health Sciences: 7%
- Law & Politics: 12%
- Science: 5.3%
- Social Sciences: 40%
- Unknown (denoted by “?”): 0.3%
UPF
- Arts and Humanities: 15%
- Engineering and Architecture: 12%
- Health Sciences: 15%
- Law & Politics: 6.2%
- Science: 12%
- Social Sciences: 39%
From Above graph we can determine that the proportions of Social Sciences, Arts & Humanities and Engineering & Architecture were high for both universities, but UOC tends to be high in Law & Politics and Arts & Humanities while UPF tend to be high in Health Sciences and Science.
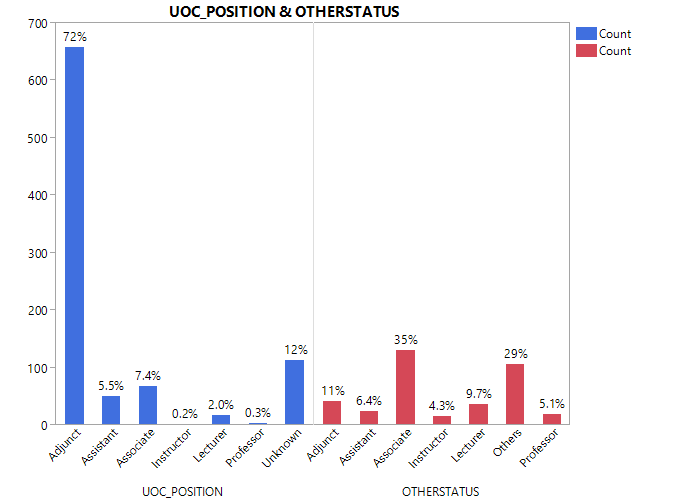
The break down of university according to position of the staff:
UOC
- Professor: 0.3%
- Associate: 7.4%
- Assistant: 5.5%
- Lecturer: 2.0%
- Instructor: 0.2%
- Adjunct: 72%
- Unknown: 12%
UPF
- Professor: 5.1%
- Associate: 35%
- Assistant: 6.4%
- Lecturer: 9.7%
- Instructor: 4.3%
- Adjunct: 11%
- Others: 29%
Clearly, from the above graph we can tell that in UOC most of the faculty are adjunct i.e. visiting faculty and it must be the case as UOC is an internet based open university. While, in UPF a public university most of the faculty are associates and many are also adjuncts.
Data Preparation
The data set, Wiki4HE, was in.csv format and was first uploaded onto JMP Pro for some recoding and some new variables were added via excel.
Firstly, it can be observed that there multiple columns for different questions. Therefore, we have to stack all the question together for each respondent, which will create multiple rows for single respondent. and two new columns will be made one for question number and one for the response for those questions.
Then, as we can observe that all the column values are in numerical format and each numerical value means something as described in the research paper. Therefore, we will recode all the columns accordingly and change the numerical values to actual string values as given in the research paper.
After that we will extract and save the file in excel format. In excel we will add two new columns namely question Type and full question using Index and Match formulas.
Now, we have prepared our data for further analysis and will do so on Tableau to extract interactive patterns. But, first we will derive some questions that we will address in our analysis.
Questions
- What is acceptance proportion for wiki in both universities?
- Among the faculty who support wiki more?
- What is the age range that accept wiki more?
- Which gender accepts wiki more?
- which question type mostly gets a score of 5?
Analysis
For analyzing the above question some graphs were created like gantt chart, parallel coordinates, tree maps.
As the responses were based on a 5-point Likert scale, it would be useful to create a visualisation of the Divergent stacked bar chart on Tableau for data exploration. Reference was taken from [3] on how to create the Divergent stacked bar chart in Tableau.
The divergent stacked bar chart gives a quick visualization of of the responses given by each respondent with respect to the question type. The filter on the right includes question type, domain, years of experience. The dashboard helps in providing understanding of the respondents' sentiments with respect to the type of questions. I can filter out domain, question type and years of experience according to my preference. for viewing different sentiments different type of question types ca be selected.
The dashboard for the divergent stack bar chart can be accessed here.
Some Insights from Divergent Stacked Bar Chart:
- Whiile looking at the responses of the faculty to the questions based on experience, it can be noted that the faculty does not make use of Wikipedia extensively for teaching purposes. From the replies to the questions, it can be observed that 55% of the faculty members does not wish to make use of Wikipedia for their students and only about 28% used Wikipedia sometimes. 67% responded to have never or rarely utilised Wikipedia for teaching materials and as a platform for development of educational activities with students, 51% responded to have never and 24% responded as to rarely.
- The faculty themselves do not contribute to Wikipedia often, as can be observed with responses from question Exp4, where 64% of the faculty members never contributed to Wikipedia and 20% rarely contribute to it, only 6% of the faculty members sometimes or always contribute to Wikipedia.
- This does not mean that the faculty members do not trust in Wikipedia materials. As they do consult Wikipedia for academic issues, about 53% of the faculty responded that they sometimes (36%) or always (17%) use Wikipedia for academic related issues. The number is higher for the use of Wikipedia for personal issues, about 61% responded that they sometimes (38%) and always (23%) consult Wikipedia for personal issues. They also did not deny the fact on the usage of Wikipedia by the students for their courses, only about 23% deny according to question Use5, while most of the faculty members are either neutral (32%) or accepting of it (45%).
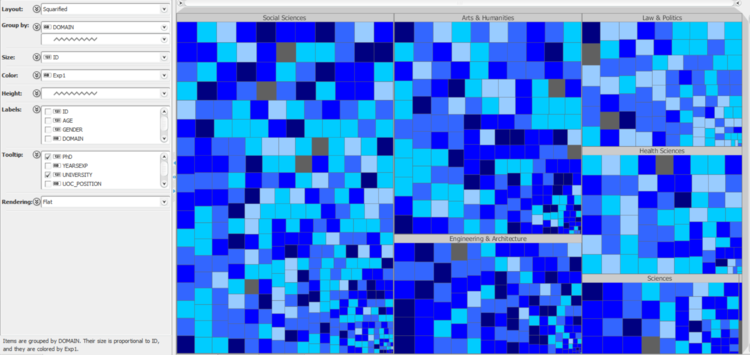
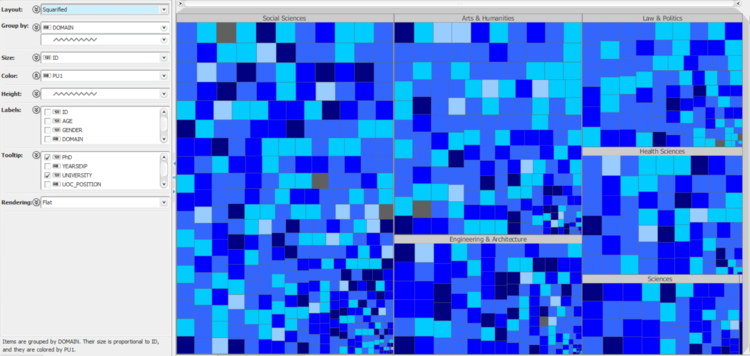
Some Insights from Treemaps:
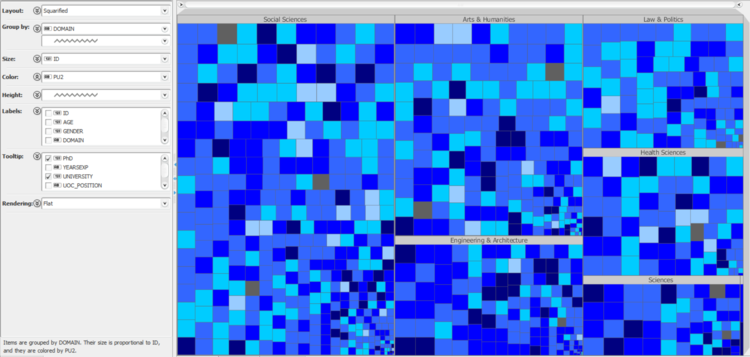
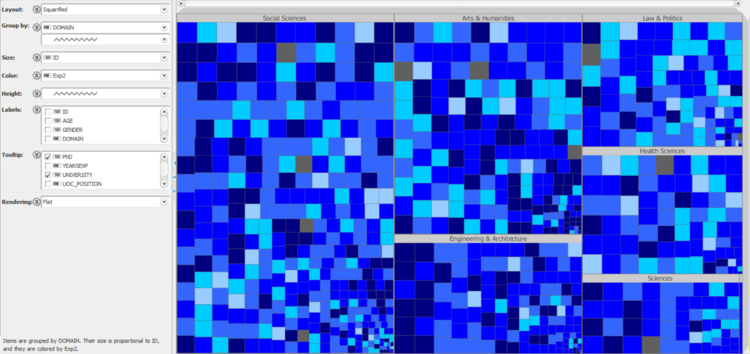
- Via Treemaps we can visualize the opinions of faculty members on the usage of wikipedian based on their respective teaching domains.
- Faculty members from Law & Politics and Health Sciences responded less favorably towards the use of Wikipedia for issues which are related to their field of expertise as compared to the faculty from Engineering & Architecture and Arts & Humanities. It can be observed from the Treemap that the colour intensity of the Law & Politics and Health Sciences are the lightest among all domain types. The faculty members from Law & Politics and Health Sciences uses Wikipedia for other purposes, they use Wikipedia for information for their personal issues.
The Parallel Coordinates chart gives a quick visualization of of the responses with respect to the question type filtered by domain. The dashboard helps in providing understanding of the respondents' sentiments with respect to the type of questions. I can view the response of faculty members from different teaching domains wrt to the question types and can ifer which type gets higher response score and which low and accordingly can judge the sentiment of the respondent.
The dashboard for the Parallel Coordinates can be accessed here.
https://public.tableau.com/profile/publish/Responsewrtquestiontype/Dashboard2#!/publish-confirm
Some Insights from Parallel Coordinates:
- The faculty responded very low for the profile type questions which means that they deny to the fact they use Wikipedia for their own domain and to improve their profile.
- They responded higher for Sharing attitude question type which means that they believe it is important to share the research work on online media platform and it equally important for students to make use of these online platforms and learn about them.
- Health Sciences and Law & Politics faculty members have responded lowest for each question type. It means that they do not rely on the use of online platforms for teaching purpose and also do not encourage their students to use them.
Tools Used
- Tableau
- Tableau Public
- JMP Pro
- Treemap (Macrofocus)
![Interactive Dashboard of Likert Scale Survey developed with Tableau. [[1]] .](/1617t1ISSS608g1/img_auth.php/thumb/2/20/Ganttchart.png/1080px-Ganttchart.png)
![Interactive Dashboard of Response wrt Question Type developed with Tableau. [[2]] .](/1617t1ISSS608g1/img_auth.php/thumb/1/10/Parallel_Coordinates.png/1080px-Parallel_Coordinates.png)