ISSS608 2016-17 T1 Assign1 Zhang Jinchuan
Contents
Abstract
Public housing is a critical and inescapable part of Singapore’s landscape. About 82% Singaporeans live in flats built by the Housing and Development Board(HDB). this article will provide an overview of the resale public housing in Singapore, in addition, the visualized insights can provide useful information for investors and also the individuals who want to buy houses in Singapore.
problem and motivation
There are three questions are focused on:
- What are the shares of the resale public housing supply in 2015.
- What are the distribution of the resale public housing prices in 2015.
- With reference to the findings, compare the patterns of the first-half of 2016 with the patterns of 2015.
From the answers for these three questions, we can get the valuable insights of the resale public housing in Singapore. Apparently, the shares of the resale public housing supply can show the basic information of the resale public housing such as the types of the houses, for families who want to buy houses, they can know the what kind of house they want and exist in the market. After that, the price is their most concern about. They can make buying strategies according to the price for suitable houses. Last but not least, the patterns of houses are essential, according to this, the buyers can know when to buy and for investors they can know the potential of investment.
.
Approaches
Data:
Search the resale public housing as the keyword in data.gov.sg. getting the data set named the resale-flat-prices. There are some attributes such as time, houses’ types, location, Area Sqm and price of the houses in this data set. First, we need to do the data preparations before we do this analysis. 1. Filter the data. (only choosing 2015-2016 data.)
According the attributes of the data set, we can get the insights from these 4 attributes (Flat Model, Flat types, Town and Storey range). By using the histogram, it is easily see the popular degree of different types.
mosaic plot
we can use the mosaic plot to better visualize the insights. For example, as for the store ranges, the mosaic plot can easily show the distribution of the public houses.
Advanced histogram
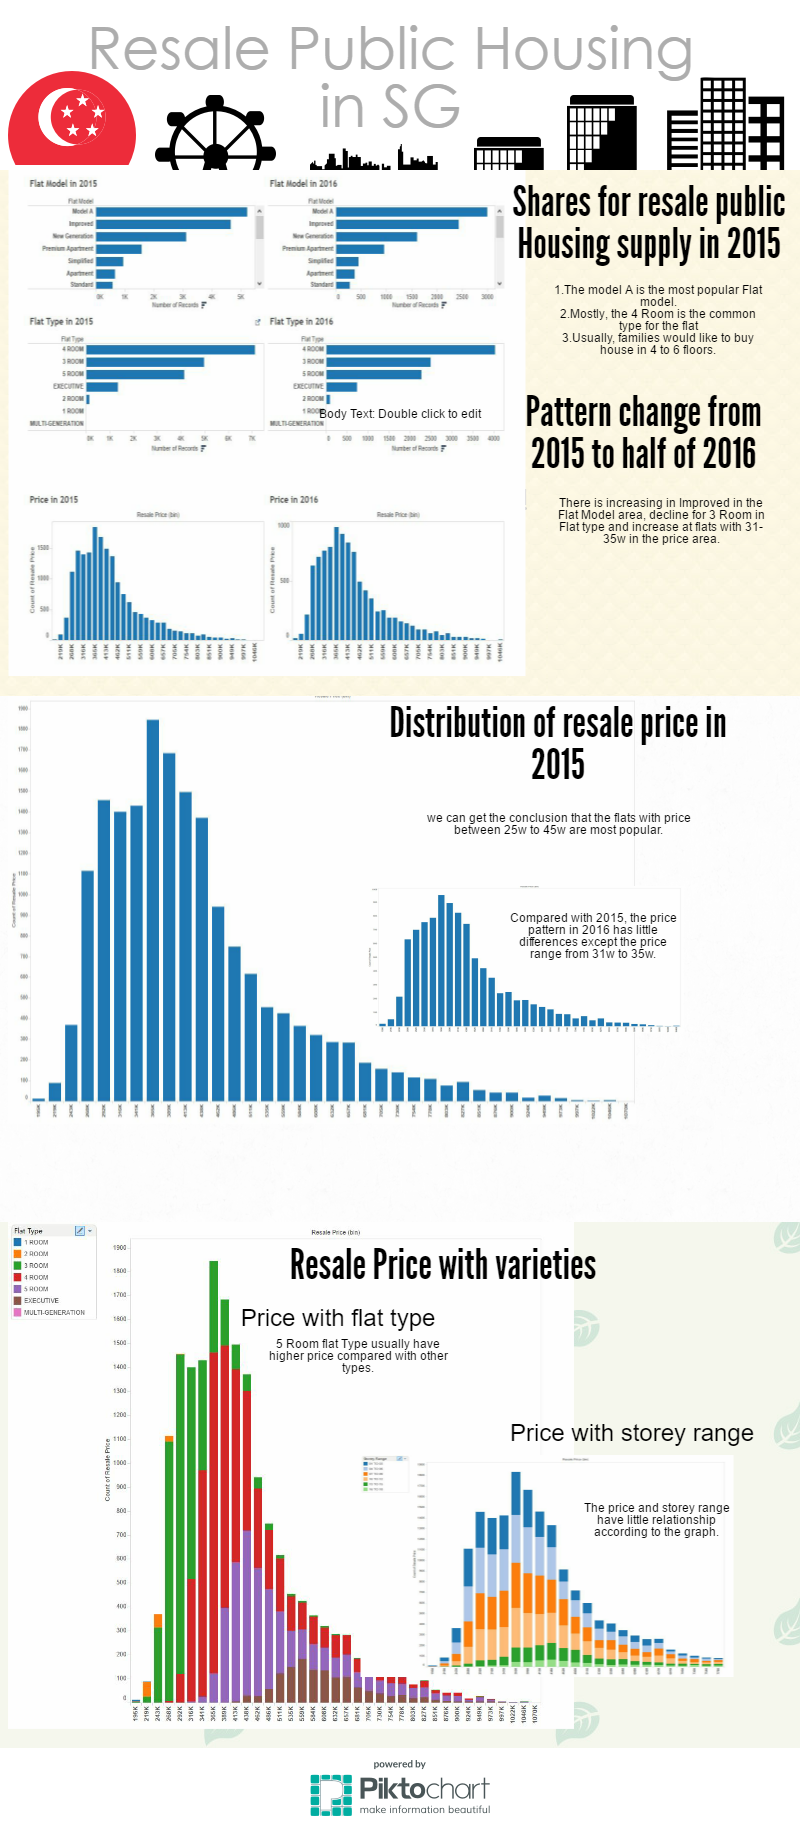
By using advanced histogram, the relationship between two varieties can be clearly showed. For instance, the flat type and the resale price’s relationship can be seen clearly below. Mostly, 5 rooms is more popular in higher price flats.
Tools
Tableau- for data visualization
Excel 2013- for data preparation
Pickochart - for infographic
infographic
result
- The model A is the most popular Flat model in 2015.
- Mostly, the 4 Room is the common type for the flat in 2015.
- Usually, families would like to buy house in 4 to 6 floors.
- We can get the conclusion that the flats with price between 25w to 45w are most popular.
- There is increasing in Improved in the Flat Model area, decline for 3 Room in Flat type and increase at flats with 31w-35w in the price area.
- 5 Room flat Type usually have higher price compared with other types.
- The price and storey range have little relationship according to the graph.
