ISSS608 2016-17 T1 Assign1 YANG Yuwei
Contents
Abstract
Buying a house is probably one of the biggest event for most of the people during their lives. Regards to buying a dream house, there are various factors the buyer has to be considered before choosing the house. (E.g. Location, Price, Floor Area etc.). In this project, I’d like to give some valued insights of resale house market in Singapore by designing analytical infographic. In detail, I will focus on the following factors which we need to consider most importantly:
- Location
- Flat Type
- Resale Price
- Floor Area
Problems and Motivation
In this project, the problems I will take into consideration as follows:
- What are the shares of the resale public housing supply in 2015?
- What are the distribution of the resale public housing prices in 2015?
- With reference to the findings, compare the patterns of the first-half of 2016 with the patterns of 2015.
Datasets
Data Description
The datasets I used for this project is Resale Flat Prices based on Registration Date from Mar 2012 to Jun 2016, which download from data.gov.sg.[1]
The data source contains resale transacted prices and more details in each transaction.
Data Transform
From the raw data, there is a column named “Lease commence date” which is numerical data, and this should be transform to data time format by using the function DATETIME in calculation field. Furthermore, I also create a new dimension called “Years” with the function “INT(DATETIME(2015 )-DATETIME([Lease Commence Date] ))” which is stand for the years from 2015 to the lease commence date the house.
Approaches
In order to solve the problem above, I use bar chart, histogram, Pareto chart and line graph to illustrate the resale housing market in Singapore.
Resale Housing Supply
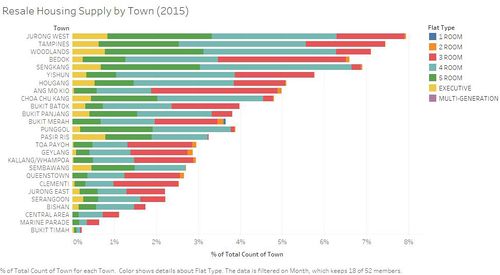
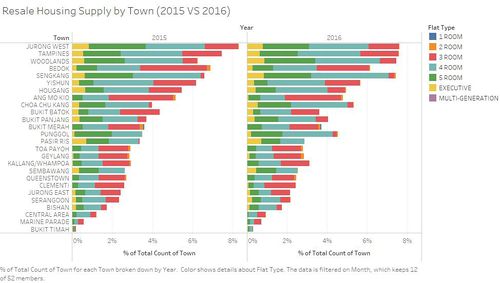
The bar chart above shows the proportion of resale housing supply by different town in Singapore 2015. It is easily find that JURONG WEST has the most number of housing which is over 8% to the total records. In the meanwhile, BUKIT TIMAH only has 0.191%. According to this fact, it will have more choices in JURONG WEST and less options in BUKIT TIMAH for buyers. This is only focus on quantity of the house, but for the house detail we should look more information in data.
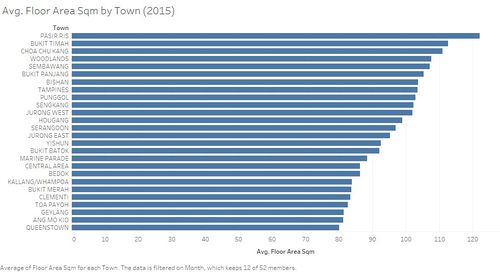
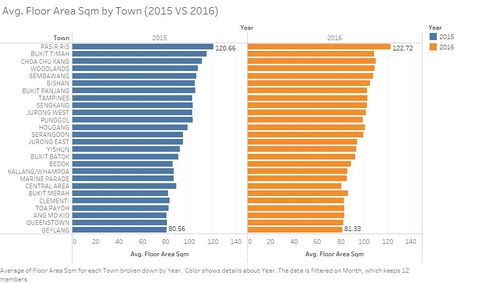
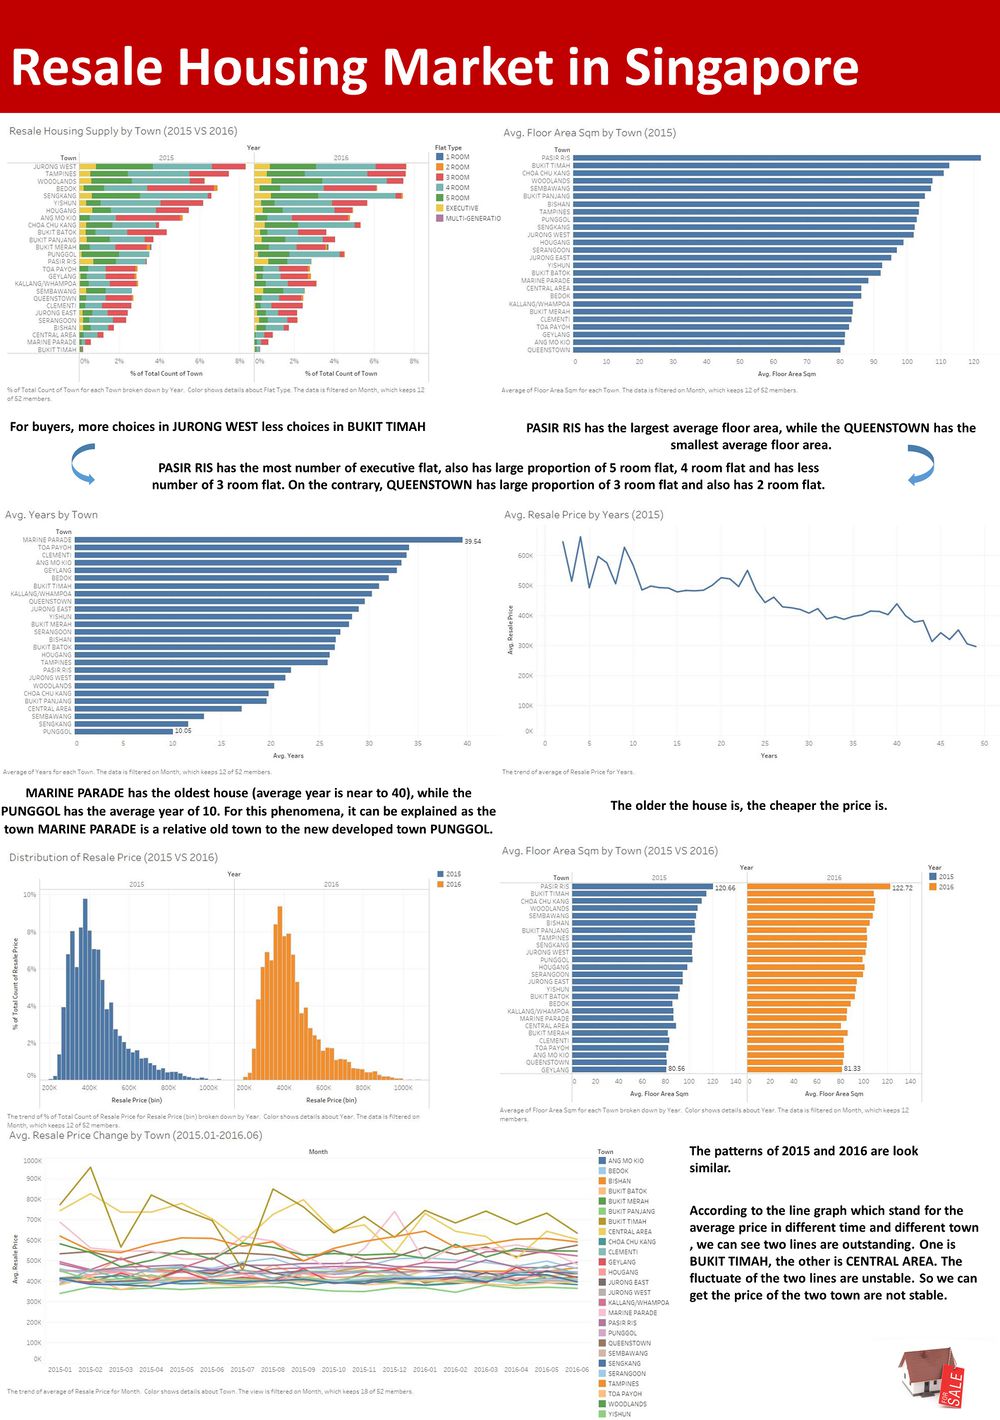
So we come to the floor area, the bar chat above is about the average floor area of each town. We can find that PASIR RIS has the largest average floor area, while the QUEENSTOWN has the smallest average floor area. There is a reasonable explanation, we should go back to the first bar chart (resale housing supply by town 2015). We can find that for the town PASIR RIS has the most number of executive flat, also has large proportion of 5 room flat, 4 room flat and has less number of 3 room flat. On the contrary, QUEENSTOWN has large proportion of 3 room flat and also has 2 room flat.
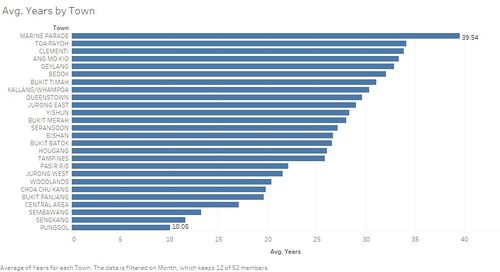
The "Years" is a new dimension I created, which is represented the “age” of the house. We can see that MARINE PARADE has the oldest house (average year is near to 40), while the PUNGGOL has the average year of 10. For this phenomena, it can be explained as the town MARINE PARADE is a relative old town to the new developed town PUNGGOL.
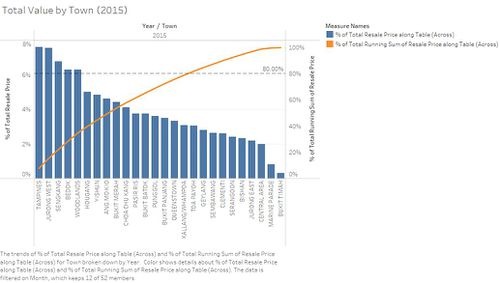
Based on the Pareto chart above, 80% of total resale value are from more than half of towns. And the TAMPINES has the most value (8% of total value).
Resale Housing Price Distribution
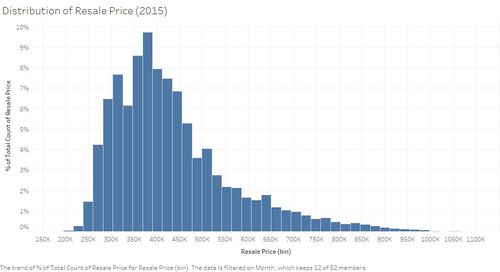
The histogram above has shown the distribution of the resale public housing prices in 2015. We can see that it is a right skewed distribution. The peak value is 369k. And most of the value are around 300k – 450k. But also have a few houses which price is below 200k, in the meanwhile, there are a few houses which price is over 1000k. So we can see that the price range is wide.
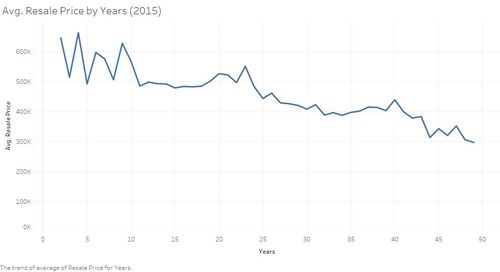
Based on the line graph above, we can easily found that as the year goes on the resale prices goes down. The older the house is, the cheaper the price is.
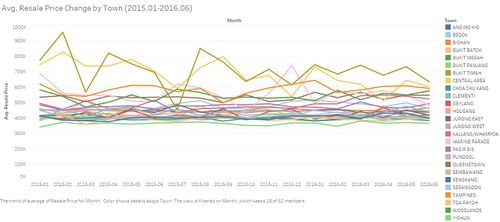
Furthermore, we can take time series analysis on average resale price by different town. According to the line graph which stand for the average price in different time and different town above, we can see two lines are outstanding. One is BUKIT TIMAH, the other is CENTRAL AREA. The fluctuate of the two lines are unstable. So we can get the price of the two town are not stable.
First-half of 2015 VS First-half of 2016
When we compare the pattern of 2015 and 2016, they look similar, except the average floor area in fist-half of 2016 is a bit larger than the average floor area in first-half of 2015.
Infographics
Tools Utilized
- Microsoft Excel
See the data overview
- Tableau
Data visualization
Results
In summary, we can get some key findings from this project.
- For buyers, more choices in JURONG WEST less choices in BUKIT TIMAH
- PASIR RIS has the largest average floor area, while the QUEENSTOWN has the smallest average floor area.
- PASIR RIS has the most number of executive flat, also has large proportion of 5 room flat, 4 room flat and has less number of 3 room flat. On the contrary, QUEENSTOWN has large proportion of 3 room flat and also has 2 room flat.
- MARINE PARADE has the oldest house (average year is near to 40), while the PUNGGOL has the average year of 10.
- The price of BUKIT TIMAH and CENTRAL AREA is not stable.
