ISSS608 2016-17 T1 Assign1 Wan Xulang
Contents
Abstract
Singapore, a modern but small city which has millions of long-term residents. To avoid problems in traffic like other modern cities have, Singapore’s government has built very strict laws to have a private car. In this assignment, we would like to know which kind of car is more acceptable by the government based the data of monthly new registration of motor vehicles. The dataset we’ll use contains two years’ record from 2014 to 2016 by month and the type of motor vehicles which is taken from: data.gov.sg
Problem
To buy a new car in Singapore, the very first thing you need to solve is the permission of registration but not which kind of car you would like to buy. In this assignment, we want to help people to solve this problem in terms of solving these problems:
- The trend of car’s registration in Singapore.
- The occupancy rates of different kinds of cars registered in Singapore at different time.
- Give recommendations based on time series analysis.
By solving these problems, we could know which kind of car is easier to be registered by government and the trend of them. In the end, we can give predictive recommendations to those who want to buy a car by time series analysis.
Approaches
Approaches Summary
In this part, we would like to introduce the data first and then do some derivations. In the visualization part, we will use bar chart, area chart and other technics to visulize our data. After these, we'll do some comparison based on time to give predictable recommendations.
Data Introduction
- Figures include weekend/off peak cars and tax exempted vehicles.
- Prior to Aug 2012, taxi operators can bid for a new COE or pay Prevailing Quota Premium (PQP) to register a taxi under Category A. The latter is only in the case of a new taxi that replaces a deregistered one within 6 months. From 6 Aug 2012 onwards, all taxis pay for COEs based on the PQP of Category A.
- Refers to the Early Turnover Scheme (ETS). Between 24 Apr 2013 and 30 Apr 2016, vehicle owners can de-register their existing diesel-propelled Category C vehicles that were registered before 1 Jan 2001 and register a replacement vehicle within 1 month of de-registration by paying a discounted Prevailing Quota Premium (PQP) under the ETS. From 1 Aug 2015, the ETS was extended to existing diesel-propelled Category C vehicles that were registered between 1 Jan 2001 and 30 Sep 2006 and will be de-registered between 1 Aug 2015 and 31 Jul 2017.
- Vehicles exempted from the VQS include scheduled and school buses, emergency vehicles, engineering plants primarily for off-the-road use, diplomatic vehicles and vehicles under the Disabled Person Scheme.
- Cars registered with COEs obtained from the Feb 2014 1st bidding exercise onwards:
- Category A: Cars up to 1600cc and 97kW.
- Category B: Cars above 1600cc or 97kW.
- Cars registered with COEs obtained before Feb 2014 bidding exercises:
- Category A: Cars up to 1600cc.
- Category B: Cars above 1600cc.
Data Preparation
Before visualize our dataset, we would like to do some preparations to it:
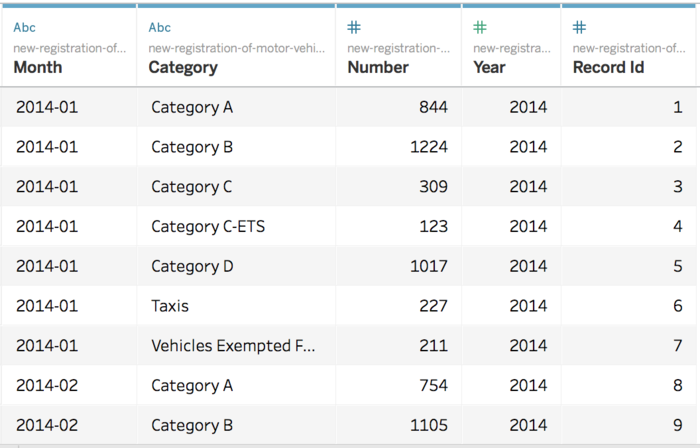
- Derive a new attribute “Year” from attribute “Month”.
- Give unique record ID to each record in the dataset.
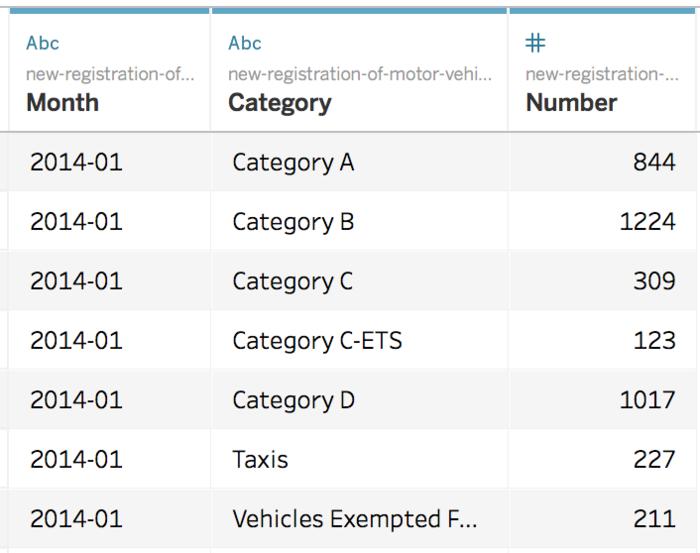
The original data:
The prepared data:
Trend of Registrations
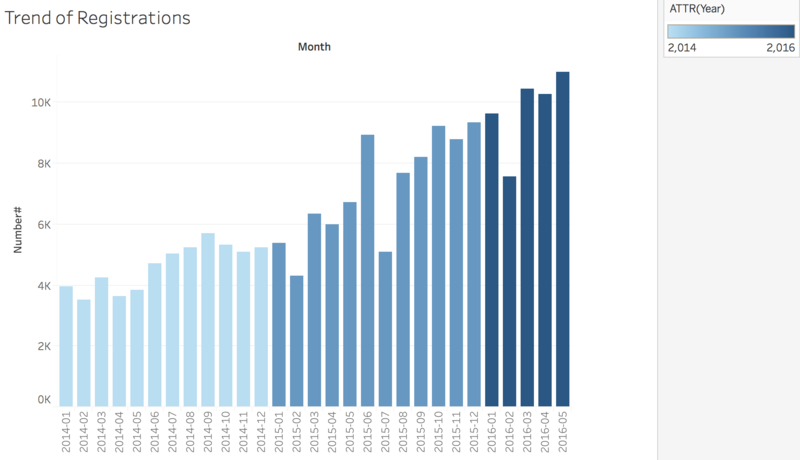
Firstly, we would like to know the trend of registrations by time from 2014 to 2016. In this step, we choose to use bar chart shown as below:
From this we can find that the number of registrations is keeping increasing from 4,000 to about 10,000 in these two years. Although, for some months, there are some drops, the number is actually increased in overall. Another thing we can notice is that the speed of increasing is quite different, before the August, 2015, the number is roiling in the area of 4,000 to 6,000 while after that time the number has increased sharply to more than 8,000 and keep in a high value to the end.
Viz Design: In this step, we are mainly focused on the trend of registrations. We’ve built a bar chart to show it. In the bar chart, we set the number of registrations in x-axis while the month in y-axis. At the same time, we set the year 2014, 2015 and 2016 as the color of each bar from light blue to deep blue to help people to see the different trend speeds of different time area.
Occupancy Rate
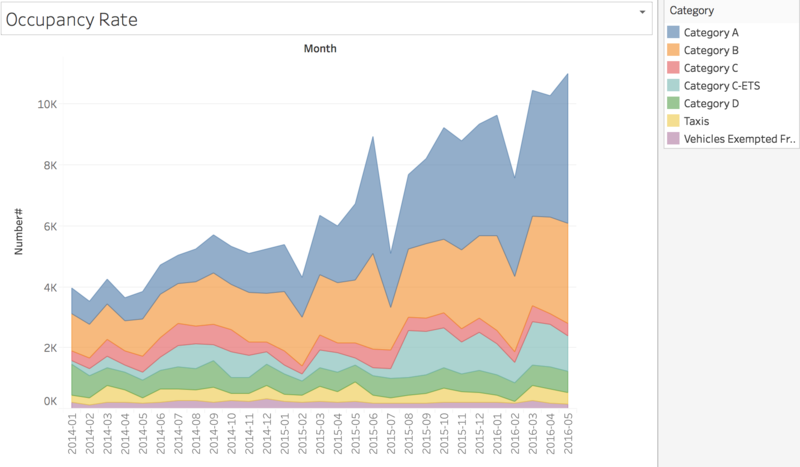
For the second step, we would like to know the occupancy rate of different kinds of cars registered in each time area. Here, we’ve built an area chart to visualize the data:
From this graph, we can identify the ratios of different kinds of cars are changing with the time. Basically, ratios of category A, B and C-ETS are taking more and more parts while the others are keeping in a same number. Compare the most important categories: A and B. They both take a big account to the total while the graph has shown that category A is a little bit more important than B.
Viz Design: In this step, we are mainly focused on the ratios of different kinds of cars. We choose to use an area chart to show it. Month is set in y-axis while the number of total is set in x-axis. To identify the category, we set it as the color of the area. In this graph, we can both identify the trend and ratio of different categories by looking for the area of different color at different time.
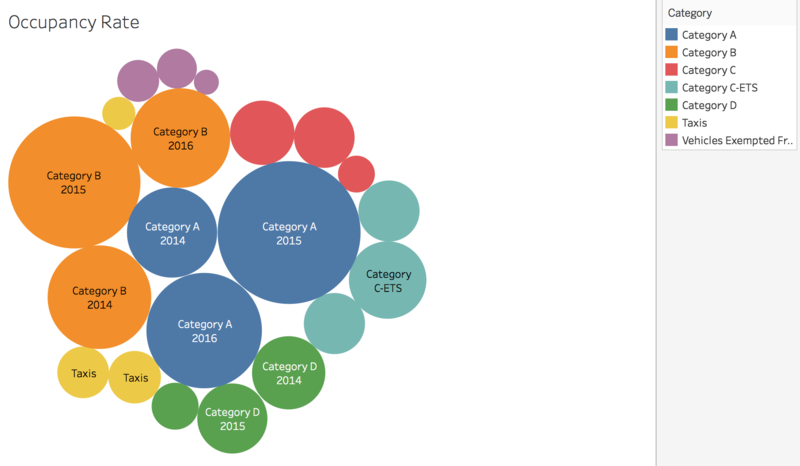
In another hand, we could also use a packed bubble chart to see the different ratio:
From this packed bubble chart, we can almost get the same result with the area chart. But one defect of this chart is that we cannot set Month as the time label or it will be too hard to identify.
Viz Design: For the bubble chart, we set the number as the size of each bubble; the category and year as the label in each bubble and then the set the category as the color of each bubble. Compare with the area chart, it’s more significant to see the different ratio of different category although it cannot tell too much information about the trend with time.
We could also use a heat map to see the change of ratios:
The result is almost the same but this heat map is much more clear to see that except category A, B and C-ETS, other categories are keep in a same level during the time.
Viz Design: For the heat map, we set month and category as the x and y axis while we set the number as the color of each square.
Time Series
As we’ve discussed before, only category A, B and C-ETS have significant change with time, so we’ll do further analysis for these three categories in this part.
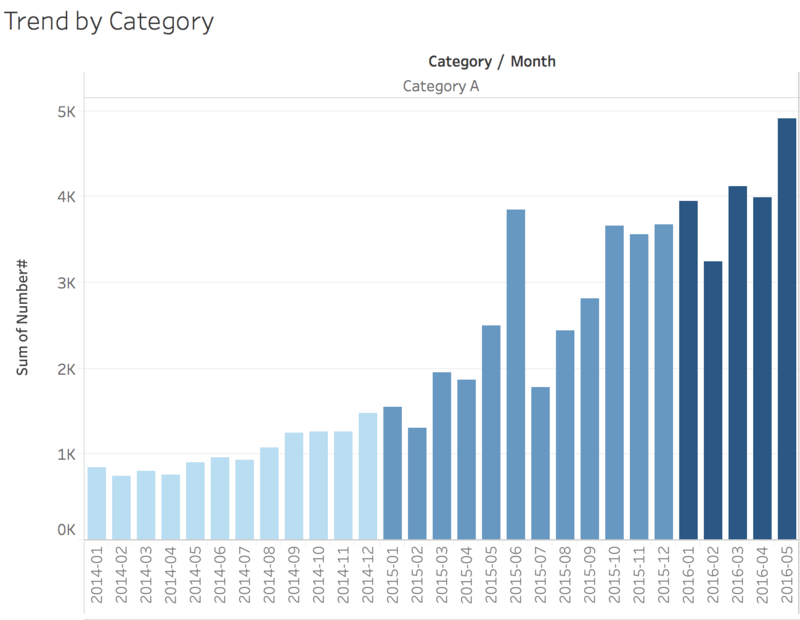
For category A, a bar chart can show the change of it by time:
From the graph, we find that the number of category A is still keeping increasing recently. Compare the data of same month on 2015 and 2016, the increases are between 1000 to 2000 in the same month. We think it’s a good assumption to say that category A will keep increasing in the future months.
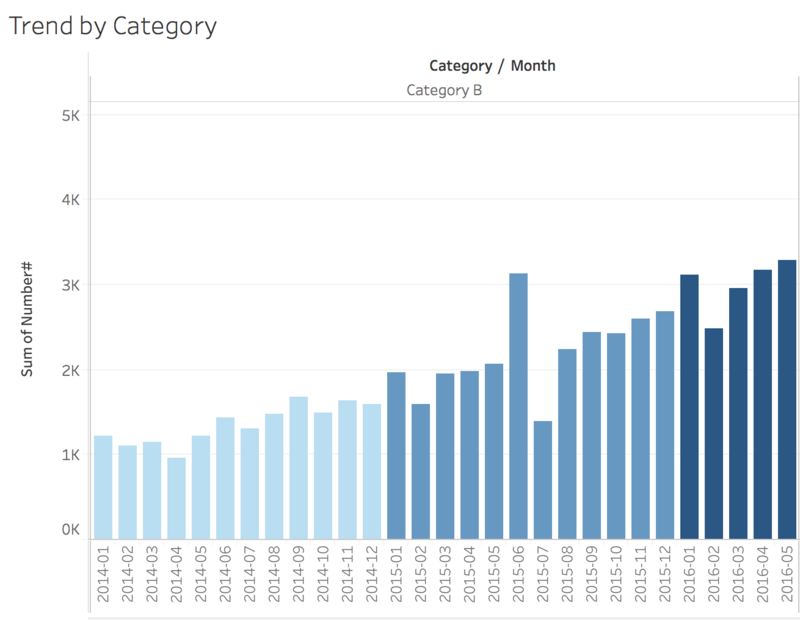
For category B, a bar chart can show the change of it by time:
From this graph, compare with category A, category B’s increase is more smooth during the time. Although it’s always keeping increasing, the increase is just about 100 or 200. We think category B will still have some place to go in the future but it won’t be too high which means that category is about to reach a bottleneck.
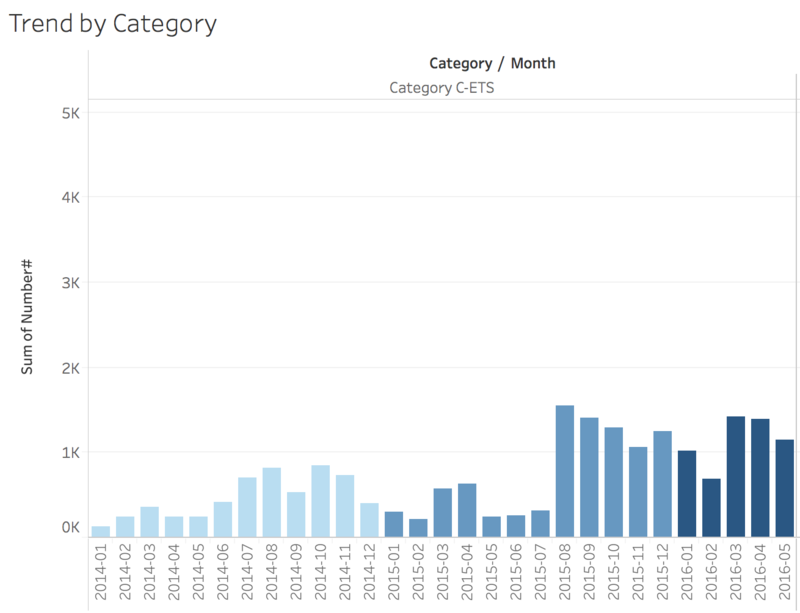
For category C, a bar chart can show the change of it by time:
For category C, it has a significant increase on August, 2015. But after that, it keeps a constant level till now. So we have to say that category will still keep in this level in the future only if there’s some changes in the restrictions.
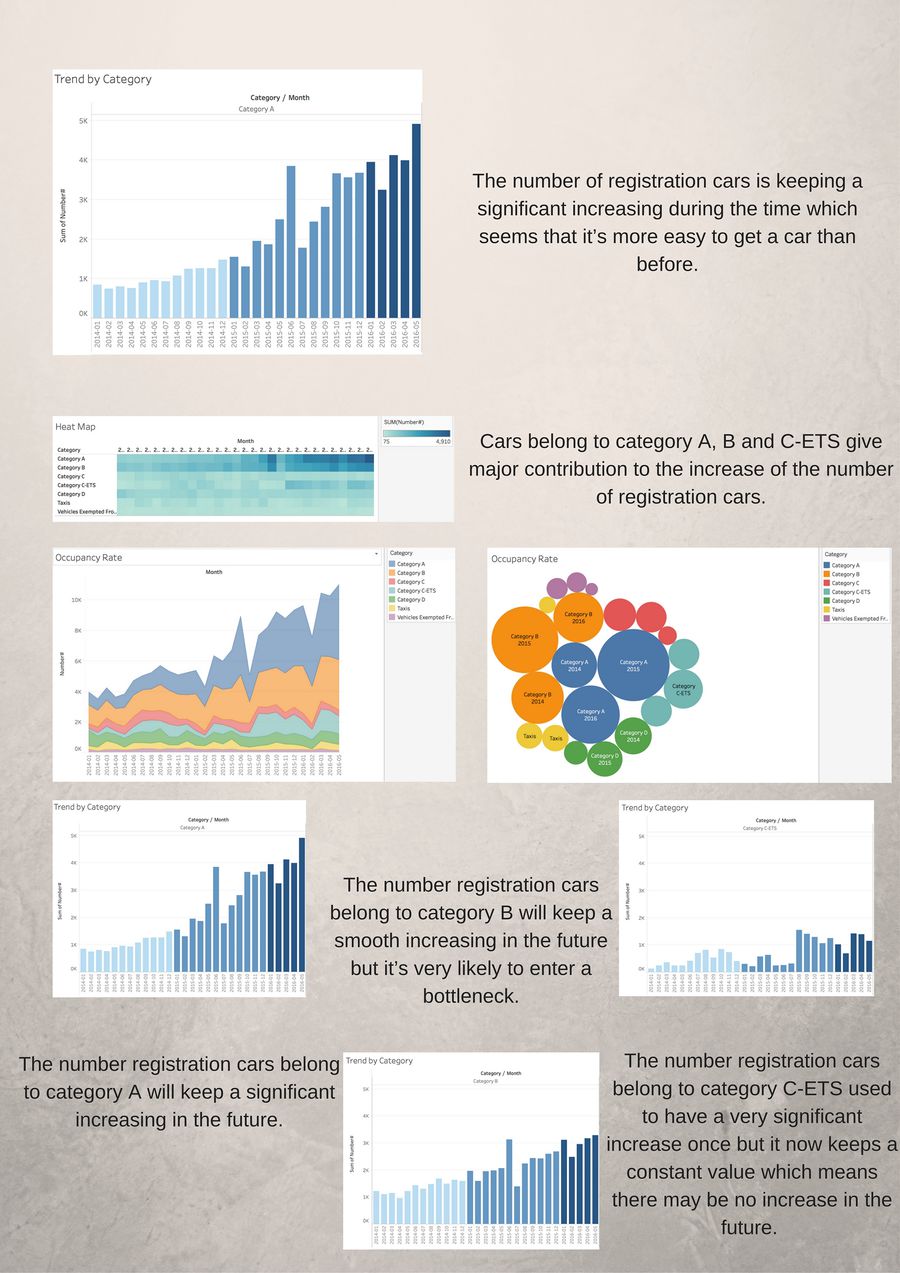
Infographics
Tools Utilised
Tool used: Tableau
Chart Used: bar chart, bubble chart, area graph, time series analysis
Technologies Used: Univariate analysis, Multivariable analysis, Time Series analysis
Result
Key Findings:
- The number of registration cars is keeping a significant increasing during the time which seems that it’s more easy to get a car than before.
- Cars belong to category A, B and C-ETS give major contribution to the increase of the number of registration cars.
- The number registration cars belong to category A will keep a significant increasing in the future.
- The number registration cars belong to category B will keep a smooth increasing in the future but it’s very likely to enter a bottleneck.
- The number registration cars belong to category C-ETS used to have a very significant increase once but it now keeps a constant value which means there may be no increase in the future.
