ISSS608 2016-17 T1 Assign1 Vishal Bansal
Contents
Abstract
More people are immigrating to Singapore in the past few years. This encourages new constructions, and well as renovations of old structures in order to create more living space. However in order to move into these new spaces, people sell their old houses, creating a supply for resale houses. With the data from data.gov.sg, for resale houses, I will be attempting to analyze it so that we may be devise a pattern which in turn could help us understand the resale market.
Problem and Motivation
This write up will be a help for buyer/seller to observe, analyse and decide the following concerns:
1. Which types of houses are sold in the market, and where these houses are located?
2. Which would be the ideal time for one to buy or sell his house?
3. Which flat types give a better value for their price?
4. The general market trend and what factors actually influence house prices.
Tools Utilized
1. Tableau
Approach
1. To showcase the share of resale public housing supply in 2015, I have used resale-flat-prices-based-on-registration-date-from-march-2012-onwards data set from http://data.gov.sg website. This data set has the various field including resale date, house location, resale value, house type, house model.
2. Since Lease Commencement date was a given as a numeric value, I converted it into a date using the following formula:
DATEADD('year',INT([Lease Commence Date])-1900,#1/1/1900#)
3. Since resale date was a given as a string value comprising of month and year, I converted it into a date using the following formula:
DATEADD('month',INT(RIGHT([Month],2))-1,DATEADD('year',INT(LEFT([Month],4))-1900,#1/1/1900#))
4. As price given was of the entire unit, the price per square meter was derived by the formula given below to give buyers a better understanding about which units had better value for money:-
[Resale Price]/[Floor Area Sqm]
5. After finding out the Lease Commencement date as well as the Resale date, we can find out the age of the house by using the following formula:-
DATEPART('year', [Resale Date])-DATEPART('year', [Lease Date])
Results
Flats by Flat Types and Models
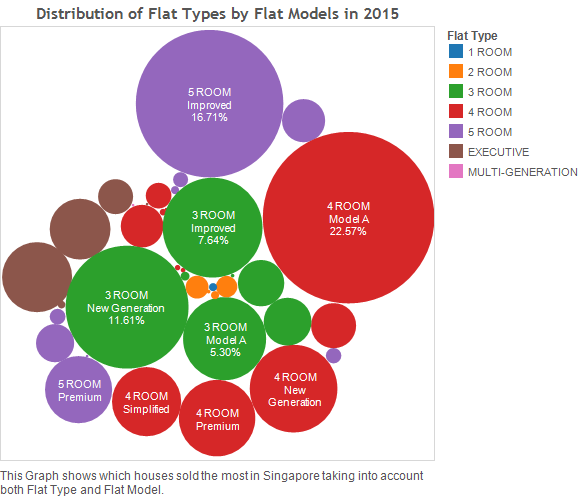
On the graph we can see that most people prefer to buy 4 room houses followed by 5 room and 3 room houses respectively. These houses between them comprise of more than 91% of houses sold in 2015.
This clearly shows that most people preferred to buy either Model A 4 room houses at 22.57% of the total houses purchased followed by Improved 5 room houses at 16.71%. These two house types alone account for nearly 40% of houses sold in 2015.
The fact that given that an average of 3.42 singaporeans live in houses[1] is interesting as it also suggests that entire flats are bought by Singaporeans to rent them out to foreigners staying in Singapore, as they cannot purchase their own property.
Flats Sold by Storeys
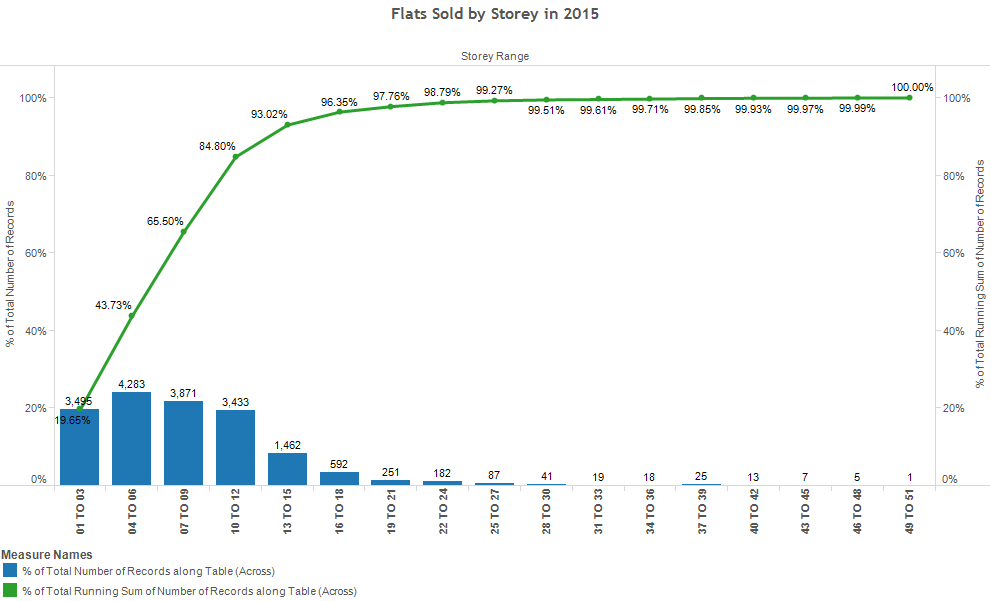
The flats below storey 15 account for nearly 93% of the flats sold in singapore in 2015, and below storey 30 that number increases to 99.5% of flats sold. Now this could be due to two reasons:
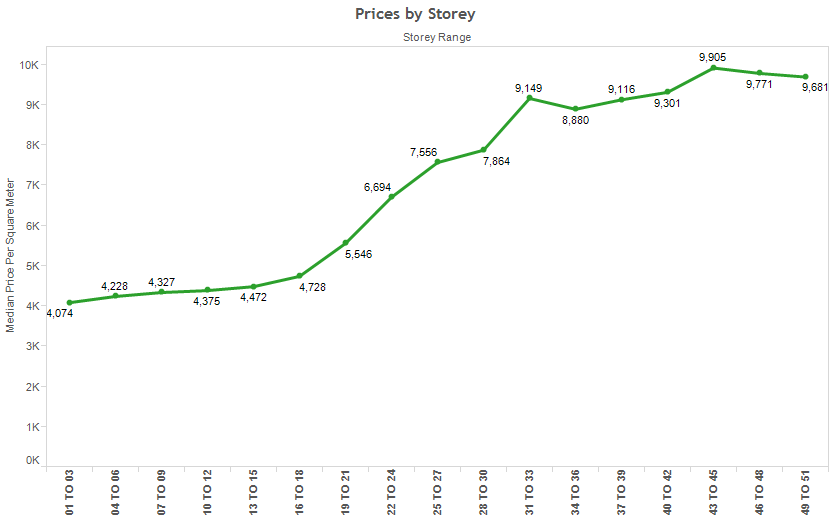
1. Higher storeys are pricier and therefore less units are sold.
The graph above clearly shows that the price increases as higher the flat is, and therefore this definitely seems like a contributing factor to less units being sold on higher floors, but there could be another reason.
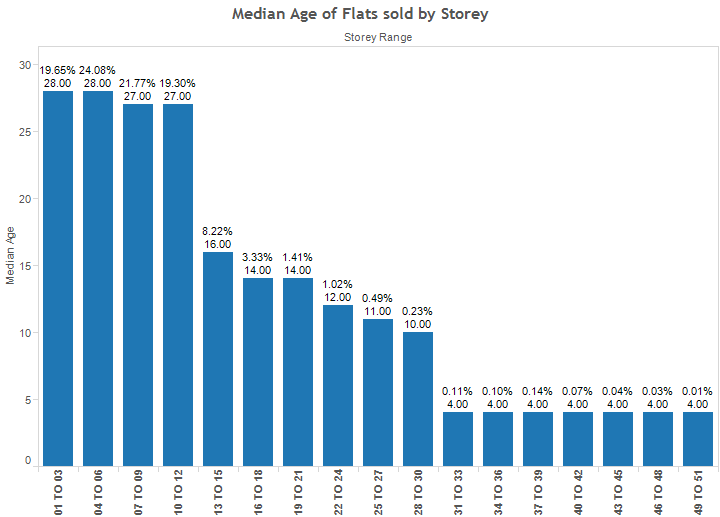
2. House owners which are selling houses live in parts of town where buildings are older and thus not as taller as other buildings, which have recently been developed.
As we can see, the flats which are at lower stories were built earlier than flats on higher stories, with flats upto 12 storeys having an average age of 27.5 years. This therefore can be also be a contributing factor.
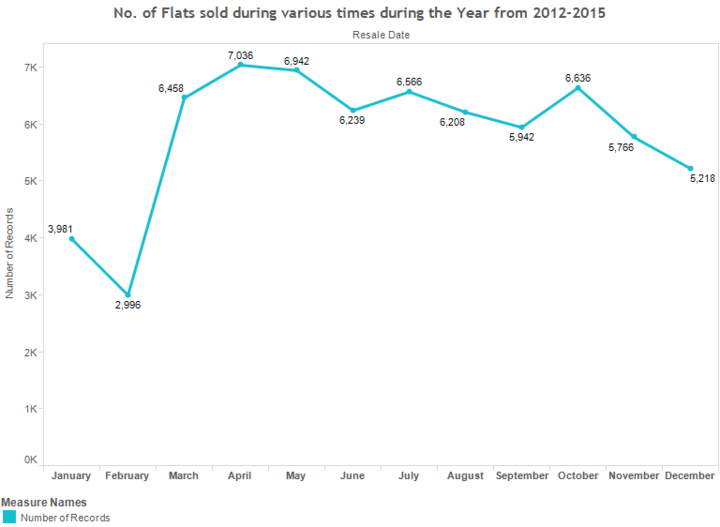
When do people buy houses?
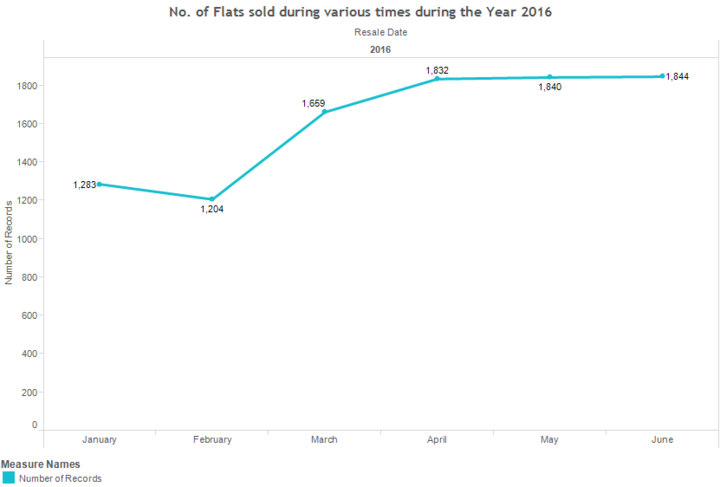
From the Graph above it is evident that sale of houses increases at the beginning of the year till mid year after which they suffer only to get a sharp boost in October after which they decline until february next year, and the pattern repeats itself.
This pattern manifested again in the first half this year as shown below:
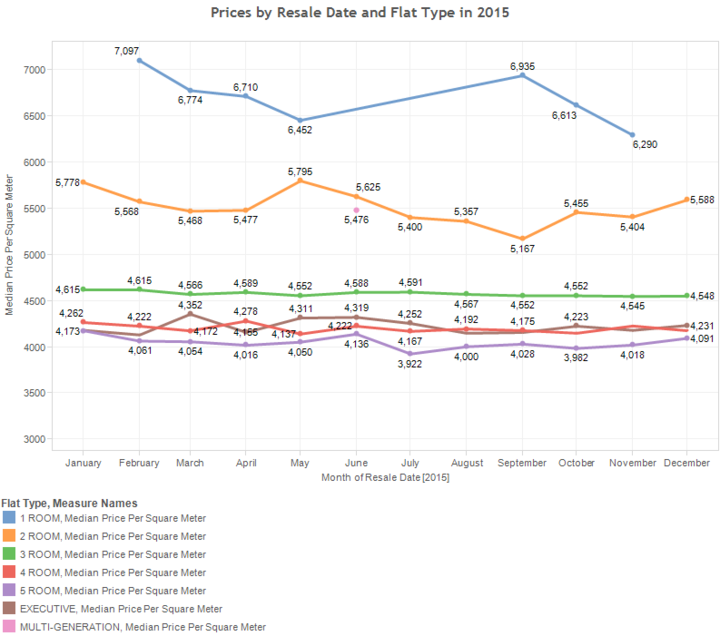
Price Fluctuations in houses throughout the year
We can see two observations from the above graph:
1. The houses appear to have a nearly constant price throughout the year, with 1 room houses being the cheapest and the prices increasing as size of the house increases.
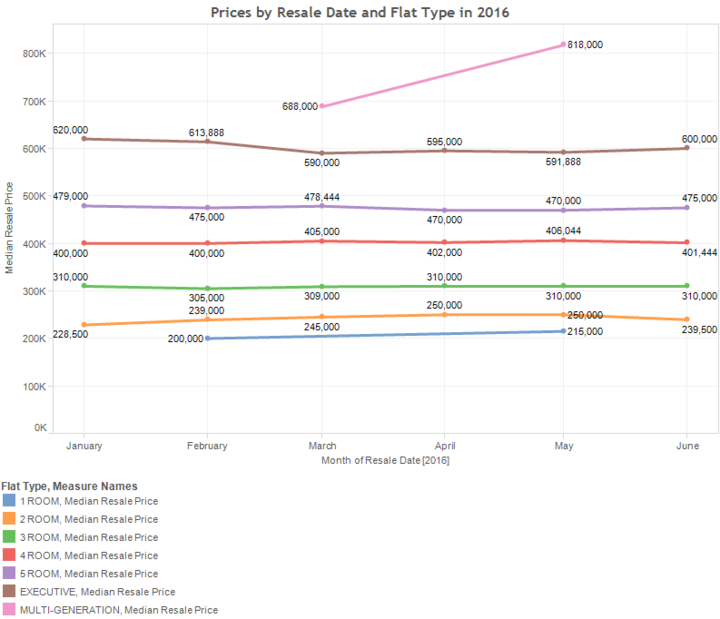
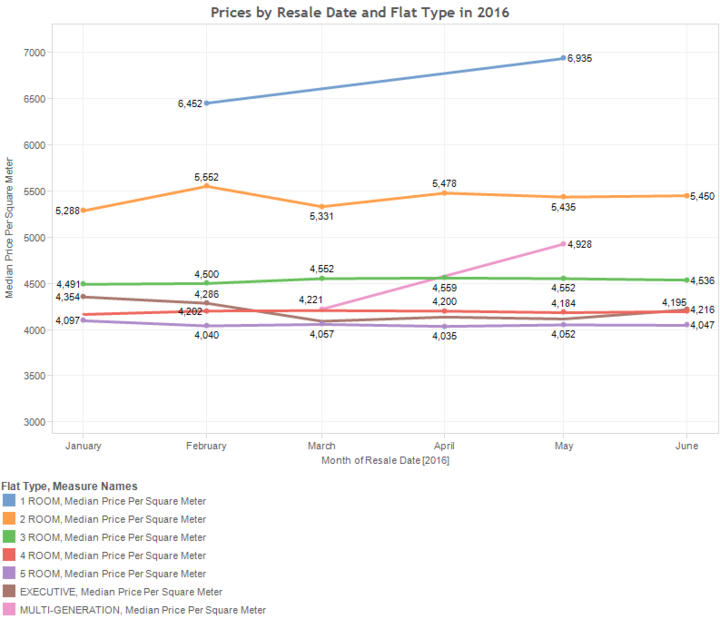
2. But we when look at the second graph we can see that despite looking to being the cheapest, the 1 room houses actually have the highest price per square meter, and that said value actually follows a reverse trend as shown by the previous graph as 5 room houses also have the lowest price per square meter.
Said pattern also nearly repeats itself in 2016 as shown in the graphs below:-
Conclusions
We can make some conclusions from this analysis. They are as follows:
1. House Prices in singapore are largely dependent on a few factors:
- Floor area,
- On which storey the house is,
- House Model
2. A few minor factors such as house location, and house type, also affect prices, but the factors above influence prices far more.
3. Houses with bigger house type generally have lower price per square meter.
4. House prices in singapore generally remained same throughout 2015, and trend seems to follow in 2016 as well.
References
- ↑ HDB statistics, facts & figuresHDB statistics, facts & figures

