ISSS608 2016-17 T1 Assign1 Liu Jialin
ISSS608 2016-17 T1 Assign1 Liu Jialin
Abstract
As most of Singapore’s citizens and permanent residents live in public housing, the stability of the resale public housing market is crucial to the welfare for the citizens. This project wants to find out the public housing resale market performance in 2015 and make a brief comparison with the first half of 2016. This aims to help the government make certain policies if there is perceived to be a need to.
Problem and motivation
A description of the problem you have addressed,
• Stability of the resale public housing, in terms of housing supply and transaction prices.
• Comparing the findings with the public housing performance in 2016 (wherever data is available).
Relevance of the problem:
• Transaction prices are most direct indication of the resale public housing market. If the prices see drastic increases or falls, policies should be taken to stabilize the market.
• Supplies, together with demand, determines the performance of the housing market. If the supply experiences sharp falls or increases, the transaction price may experience sharp rises or falls.
• As demands are harder to predict, the project main focuses on supply instead of demand.
Main variables involved
• Quarterly Housing Development Board (HDB) flat resale registration, by flat types.
• Price per square meter of the resale HDB flat, by towns, flat types, transaction records and transaction values.
• Flat type shares made up by flat models.
• Quarterly mean price per square meter of the resale HDB flat, by flat types.
• Quarterly HDB supply as a share of yearly HDB supply.
What development policy questions you intend to address.
• Prices, distributions and of the current resale public housing market.
• Any policies necessary to stabilize the resale public housing market.
Tools Used
Tableau 10.0 software: bar charts, box plots, tables, and line graphs.
Approaches
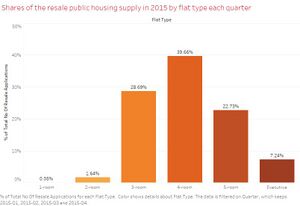
Graph 1 is used to obtain an overview of the yearly flat supplies by type. Orange is used because it is similar to the red colour HDB. Since red colour is reserved for later, now orange colour is used. Darker colour means bigger flats.
Horizontal bar charts were considered but dropped, because one category, namely the 1-room flats, became unnoticeable on a horizontal bar chart.
Double axis was considered for the shares by quarter bar chart. One axis would be the percentage of total supply in 2015, the other is the exact number of applications filed that quarter. However, since the two lines largely overlap and basically indicates the same trend, only one is kept.
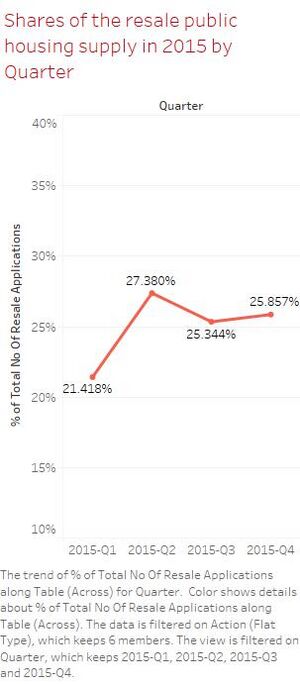
Graph 2 is also used to obtain an overview of the yearly flat supplies, but by quarter. This is an important aspect of shares of public housing resale, as government may find the appropriate time to roll out the respective policies. Line chart is used here because the increases and decreases are clearly shown.
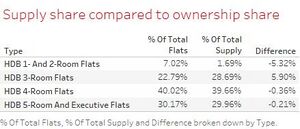
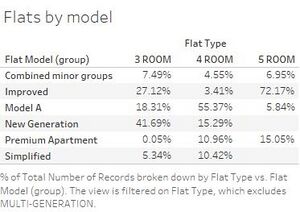
Table 1 is used to identify which group of flat type owners are more likely or less likely to sell their flats. This can act as a reference to determine the number of new flats built in future HDB projects. A table is used here because the differences are not great so numbers are quite straight forward.
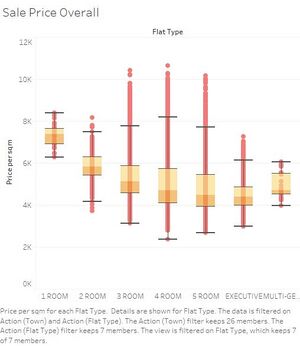
Graph 3 is used to view the overall price per square meter distribution for the different flat types. Comparing using overall price is not the best option because the floor areas vary and the value of the flats vary. The box plot is easy to see the skewness of the price distributions. Red HDB colour is used.
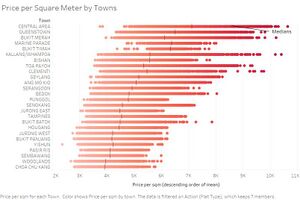
Graph 4 is used to display the distribution of price per square meter by town. As graph 3 shows a lot of right skewness, it may be due to location reasons. Darker colour means higher price per square meter, and distributions for each town is plotted.
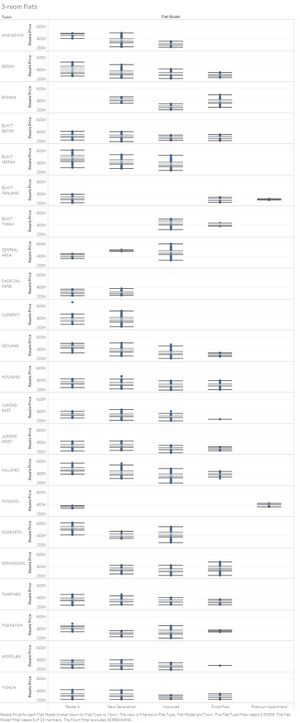
Graph 5 is used to find out that given the same town, does model of the flat impact the price per square meter distribution? 3-room flats are selected, and after removing the rather rate categories according to table 2 and towns largely uniform flat models, the conclusion is that flat models do not really impact prices per square meter.
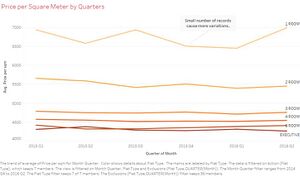
Graph 6 shows the price per square meter in first half of 2016 by flat types. The only fluctuation happens at 1-room flat, but this is due to small number of transactions. Overall, Graph 6 shows a stable price trend.
Graph 7 (although very packed) shows the price distribution trends in 2015 and first half of 2016. Direct visual comparison can be done just by comparing the directions of lines, and some notable traits are marked out.
Tools Utilised
Tableau 10.0 software: bar charts, box plots, tables, and line graphs
Results
What are the shares of the resale public housing supply in 2015 (at least three observations)?
Registration indicates the willingness and ability to sell a self-owned HDB flat. Hence the Number of Resale Applications Registered by Flat Type is used.
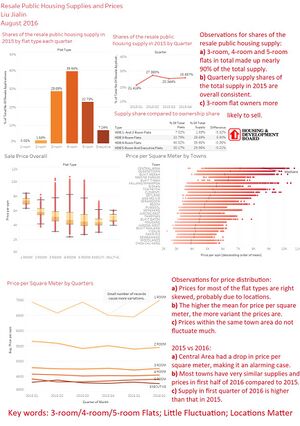
Observation 1: 4-room flats made up nearly 40% of the total resale public housing supply, becoming the overall majority (Graph 1).
These are likely from families with five people or more (including but not exclusive to children, parents and grandparents). The middle-aged owners sell their flats probably because they are upgrading to better housing options such as condominium. Senior citizen owners may sell their flats to downsize to a smaller flat as their adult children move out. More data is needed to see which group is the majority.
Observation 2: quarterly supply shares of the total supply in 2015 are overall consistent. Quarter 2 has the highest supply and Quarter 1 has the lowest supply (Graph 2).
This is probably because Chinese New Year is in Quarter 1 and people are likely to postpone their major decision making. However, the effect is not very significant because the registration takes time to be approved, thus the owners may not be immediately involved in the selling process.
Observation 3: 3-room flat owners are more likely to sell their flats, while smaller flat owners are less likely to sell their flats (table 1).
This is compared to proportion of HDB flat types. Due to the combined number of HDB 5-Room and Executive Flats, a direct comparison is not appropriate thus not displayed. However, from the table the supply is largely consistent with the flat owner proportion. 1-room and 2-room flat. If government needs to decide on the new HDB types built, they probably should increase the number of small flats and decrease the number of 3-room flats.
What are the distribution of the resale public housing prices in 2015 (at least three observation)?
Use Price per Square Meter:
1. All flat types display a right-skewed price distribution. 3-room, 4-room, 5-room flats price distribution are particularly right-skewed. This may be due to location influence (graph 3).
2. Prices indeed vary a lot by locations. Towns with higher mean price per square meter has larger variation within town (graph 4).
3. Main flat models have very little impact on the price per square meter of resale public flats (table 2 and graph 5).
With reference to the findings, compare the patterns of the first¬half of 2016 with the patterns of 2015.\
1. Central Area had a drop in price per square meter, making it a unique case.
2. Most towns have very similar supplies and prices in first half of 2016 compared to 2015.
3. Supply in first quarter of 2016 is higher than that in 2015.
