ISSS608 2016-17 T1 Assign1 Linda Teo Kwee Ang
Abstract
The cooling measures implemented by the Singapore government is supposed to ensure a stable and sustainable property market. However the prices of the property are still subject to volatile situations due to market forces. On and off there will be news on certain HDB units sold at record prices, and it may be hard to fathom the underlying reasons for such prices.
Problem and Motivation
“The public housing resale market has continued on its long stabilisation path”, according to Singapore Real Estate Exchange (SRX) in a Straits Times article dated 5 Aug 2016 [1]]. The cooling measures introduced by the Housing Development Board (HDB) over the past seven years (since 2009) seem to be taking effect, with a general downward trend in the number of resale flats transacted over time. However, quite often we do hear of news on certain HDB units sold at record prices, hence one may still wonder whether the property market is stable or not.
Approaches
HDB resale data obtained from data.gov.sg was analysed. The Resale Flat Prices data set selected covers the period of Mar-2012 to Jun-2016, and has quite a good range of information for analysis, like resale flat prices based on date of registration, town, flat type/model and lease commencement date [2]].
Such data provides the scope for the following comparisons over time:
- Towns – to show distribution of resale flats sold across 27 towns in Singapore
- Flat type – to show the relative size of the resale flats. The more rooms the flat has, it will be relatively bigger in floor area
- Storey range – typically the higher the flat is, the higher the price it is able to fetch
- Lease commencement date – the age of the flat can be determined from calculating the number of years since the flat was leased, assuming that the resale transaction was made by the first owner.
- Resale price – the price of the flat in the resale transaction
Tools Utilised
Tableau was mainly used to run the data.
Data preparations: The data set is not ready for use immediately. Slight calculations were required in the following:
- Conversion of Date field: The Date field of the data set was in the format YYYY-QQ, as in “2012-03” for 2012Q3 and was treated as string character field by Tableau. To convert to a date format, the following formula was used on the Month field: DATEADD('month',INT(RIGHT([Month],2))-1,DATEADD('year',INT(LEFT([Month],4))-1900,#1/1/1900#)).
- Standardisation of Lease Commencement Date: The Lease Commencement Date was actually in YYYY format. A similar conversion was done using DATEADD('year',INT([Lease Commence Date])-1900,#1/1/1900#).
- Calculating a proxy for flat age: Given the standardisation of dates above, the age of flat is estimated by getting the difference between transaction date and lease commencement date. The formula used was ([Year-Month]-[Lease commencement year])/365. As this estimated age is likely to be overstated, given that lease commencement date was using default 1st Jan of the respective years, this calculated field is rounded down to a whole number using if [Age of flat]=int([Age of flat]) then [Age of flat] elseif [Age of flat]<0 then int([Age of flat]) else int([Age of flat]+1) end.
- Calculating the price per square metre of resale prices: The prices in the resale transactions were expressed in absolute price of the units. For a more uniform comparison, the prices were converted to price per square meter (psm) using [Resale Price]/[Floor Area Sqm]
During analysis:
The use of tooltips and colour markings will be very useful when making distinctions across the voluminous data. For tooltips, it is recommended that important data like street name, blk and storey range be applied, to better interpret the results when hovering over the points.
Preparation of infographics:
This infographics is designed for the purpose of sharing with the mass public. Hence the technical statistical analysis is minimised, and the charts/diagrams in the infographics was deliberately selected for ease of interpretation by a layman.
Results
General observations
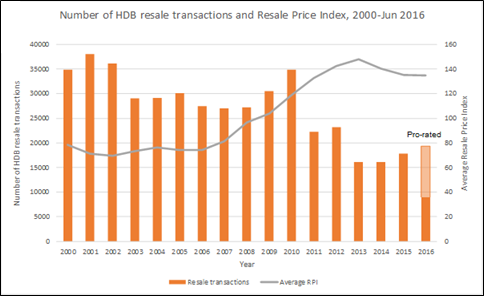
Generally, the number of HDB resale flats transacted over the past 10 years is on a downward trend, with slight upheaval in the last two years. The year 2016 may show an increase from 2015, based on pro-rated figures. The average RPI, on the other hand, shows an opposite trend, with increasing index over the years, only to decrease in the last two years.
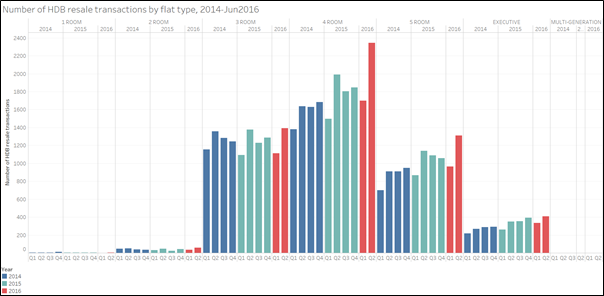
A breakdown of the resale transactions by flat type over the past two years showed that the flat type which caused the increase in transactions, were mainly 4-room and 5-room flats. This is expected, given that 4-rooms and 5-rooms made up the vast majority of type of dwellings by residents [3]]. The second quarter of 2016 saw a spike in these two flat types, hitting the highest quarterly figures in these three years. A more in-depth analysis will be done on these two room types in the sections below.
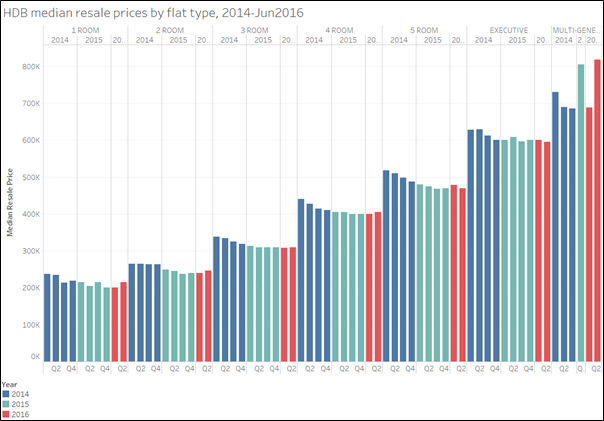
In terms of resale prices, when compared across quarters using the median price, the trend for most flat types is similar to that of the overall trend. Only the multi-generation flat type registered sharper fluctuations, owing to a two individual units transacted at high prices in Jun 2015 and May 2016, at Bishan and Tampines respectively. As the number of transactions for multi-generation flats is small, they will not be covered in the sections below.
Resale transactions in 2015
The first part of the analysis focuses on the volume of resale transactions in 2015. Key observations were as follows:
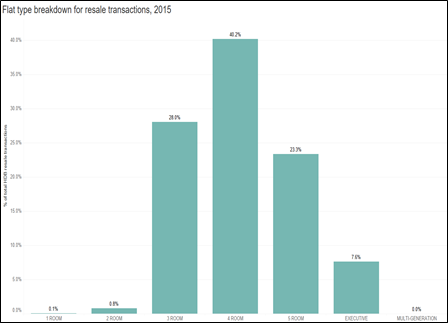
- Majority of the resale flats were 4-room flats (40%), followed by 3-room flats (28%), and 5-room flats (23%).
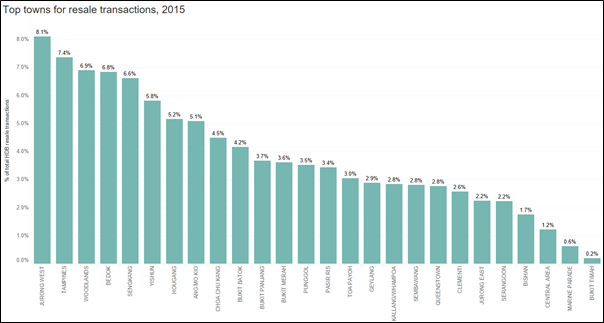
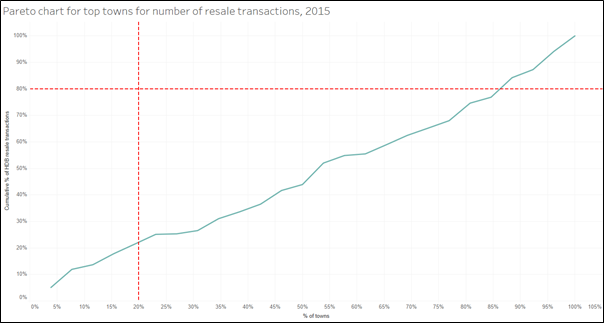
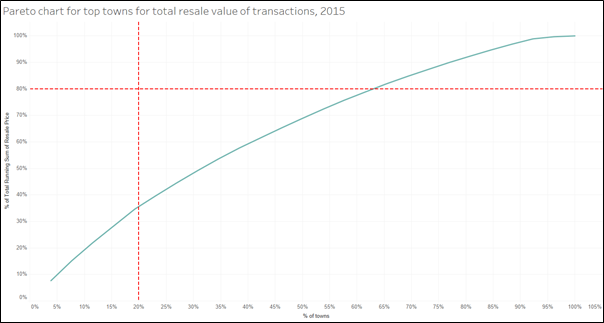
- The top locations of the resale flats were far from central part of Singapore – the top towns were namely Jurong West (8%), Tampines (7%) and Woodlands (7%). This proportion is not surprising, given that the distribution of HDB dwellings are also highest in these towns, based on Census of Population 2010 [4]]. The proportion taken up by central area was only 1%. Because of the low proportions for each town, the 80%-20% rule does not apply – from the Pareto Chart, 80% of total resale transactions was between 85% and 88% of the towns, and 20% of the top towns was only able to capture about 21% of total transactions.
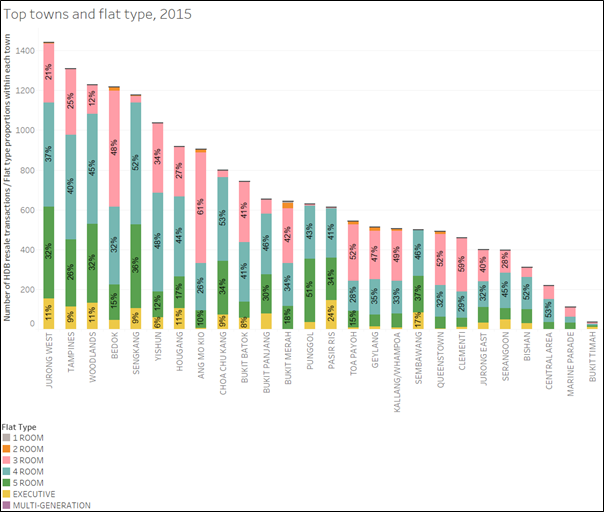
- The flat type compositions within each town may differ. Largely, most of the top towns saw higher proportions of 4-room flats sold, except for Bedok and Ang Mo Kio which saw more 3-room flats sold. This is because Bedok and Ang Mo Kio are the older/more mature estates in Singapore with higher proportion of elderly residents. Such older estates will also tend to have more 3-room flats built in the late-1970s.
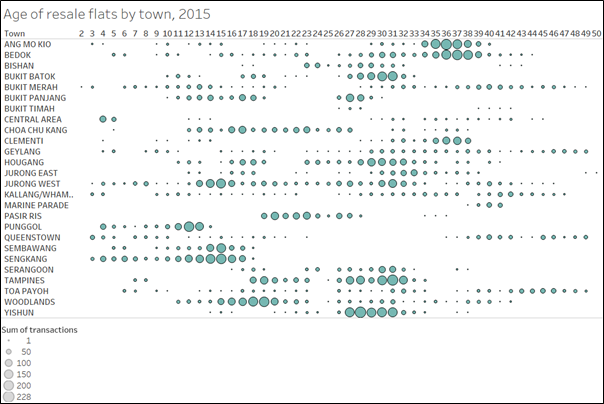
- The younger flats sold were mainly at Punggol, Sengkang, and Kallang/Whampoa. They were roughly distributed as follows:
       - Not more than 5 years: Punggol, Sengkang, Kallang/Whampoa
       - Between 6 and 10 years: Sengkang, Jurong West
The second part of the analysis focuses on the prices of resale transactions as well as price per square metre in 2015. Key observations were as follows:
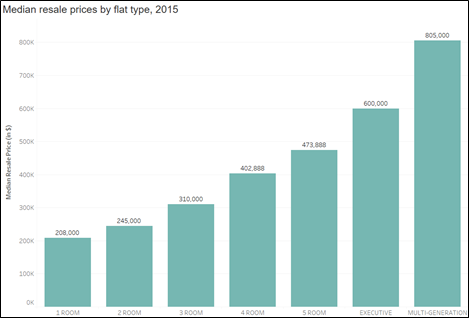
- Median resale prices for resale flats was $402,888 in 2015. The respective median prices for different flat types were as follows: 1-room: $208,000; 2-room: $245,000; 3-room: $310,000; 4-room: $402,888; 5-room: $473,888; Executive: $600,000; Multi-generation: $805,000
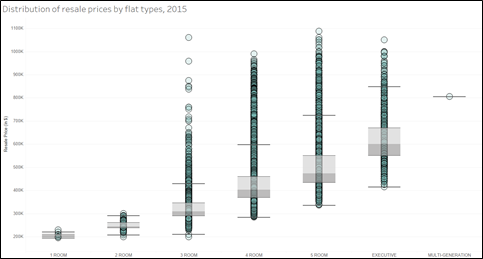
- The inter-quartile ranges of resale prices were widest for the 4-room and 5-room flats. It was noted that the resale prices for some 3-room flats were higher than that of the 4-room flats. Upon further checks, this group of 3-room flats were actually 3-room terrace units at Jalan Ma’mor, Jalan Bahagia and Stirling Road. It should be noted that such terrace units tend to fetch higher prices due to their “landed” nature. Despite this, the plot was still able to deliver some interesting findings: (a) The standard 3-room flats which fetched higher prices were mostly at Bukit Merah, despite them being older flats. This group of resale flats which were leased in 1970s, were sold for at least $60,000. (b) The 4-room flats in Central area, in particular at Cantonment Road, were sold at prices between $780,000 and $990,000, depending on their storey levels. (c) The 5-rooom flats in Central area at Cantonment Road was able to fetch close to $1.1M.
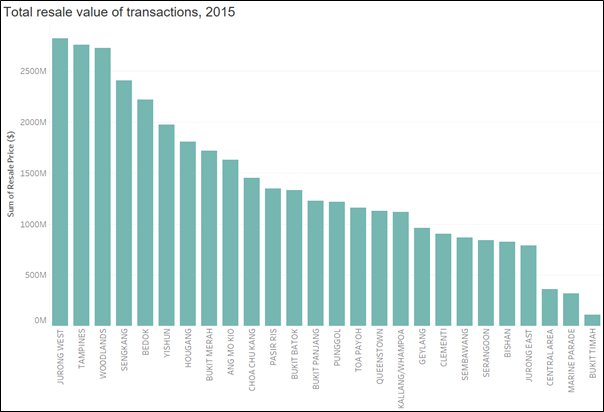
- The towns with higher total resale transaction value were consistent with the top towns with highest transaction volume – Jurong West, Tampines and Woodlands. On the Pareto Chart, 80% of total resale value was around 63% of the towns.
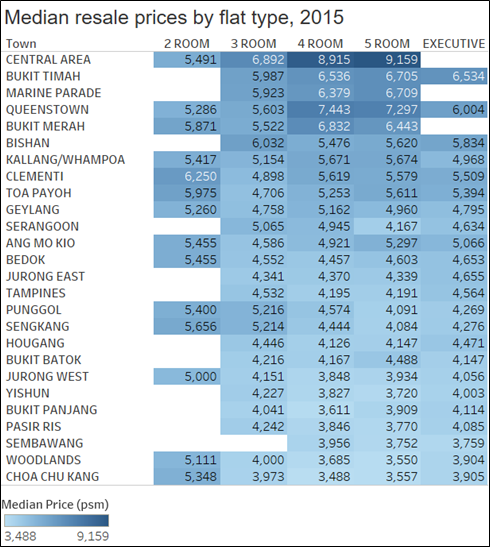
- Based on resale price per square metre, the towns which saw higher price per square metres were noted to be Central area, Bukit Timah and Marine Parade. Along the same line, the towns which saw the lowest price per square metres included Choa Chu Kang, Woodlands, Sembawang, Pasir Ris and Bukit Panjang, depending on flat type. Of interest, a flat in Central area can cost twice that of a 4-room/5-room flat (of similar type/size) in these locations.
Comparison of resale transactions in 2016 to 2015
A similar set of analysis was performed on the resale transaction volume and prices for Jan-Jun 2016. There were no obvious changes in the shares of resale transaction in 2016 compared to 2016:
- Proportion of 3-room flats out of all flat types dropped slightly, by 2.1% points. Most of the other flat types registered slight increases in proportions
- Top towns remained as Jurong West, Tampines and Woodlands. Towns which were at the bottom were also consistent with 2015, being Bukit Timah, Marine Parade and Central area.
- No obvious changes to the proportions of flat types sold within each town.
- No obvious changes to the ages of flats sold within each town.
In terms of prices,
- Median resale price for 1-room and 5-room flats rose by 2.2% and 0.23% respectively while the other flat types either remained comparable or saw decreases.
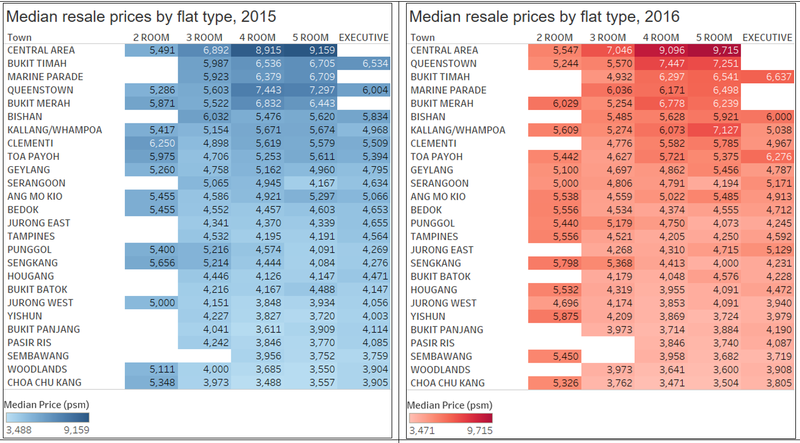
- There were fewer "abnormalities" in the resale prices for 3-room flats - note fewer outliers in the chart below. For better reference, the chart for 2015 is reproduced beside the chart for 2016.
- The towns with highest median prices per square metres remained comparable, although Queenstown managed to move up the ranks. Increases in median prices per square metres was noted for selected towns like Central area, Queenstown, Bishan, Kallang/Whampoa, for different flat types.The towns at the bottom levels mainly registered decreases in their median prices per square metres in 2016 compared to 2015.
In the course of this visual analysis, there are already a few areas noted for further checks/developments.
- Price: Why the extreme high prices in certain flat units? What are the market forces driving these prices, and any need for government intervention?
- Age of flats: Interestingly, it was noted that the resale transactions for older flats (more than 40 years old) has been increasing over the years. Typically flat buyers tend to go for the younger flats. Is this trend reflecting any social behaviour, eg a special buying behaviour for a certain group of buyers?
- Flat type: Why are 3-room terrace units lumped under the flat type of 3-roomers? Such terrace units are likely to fetch higher prices, and may distort the figures during statistical analysis
Infographics
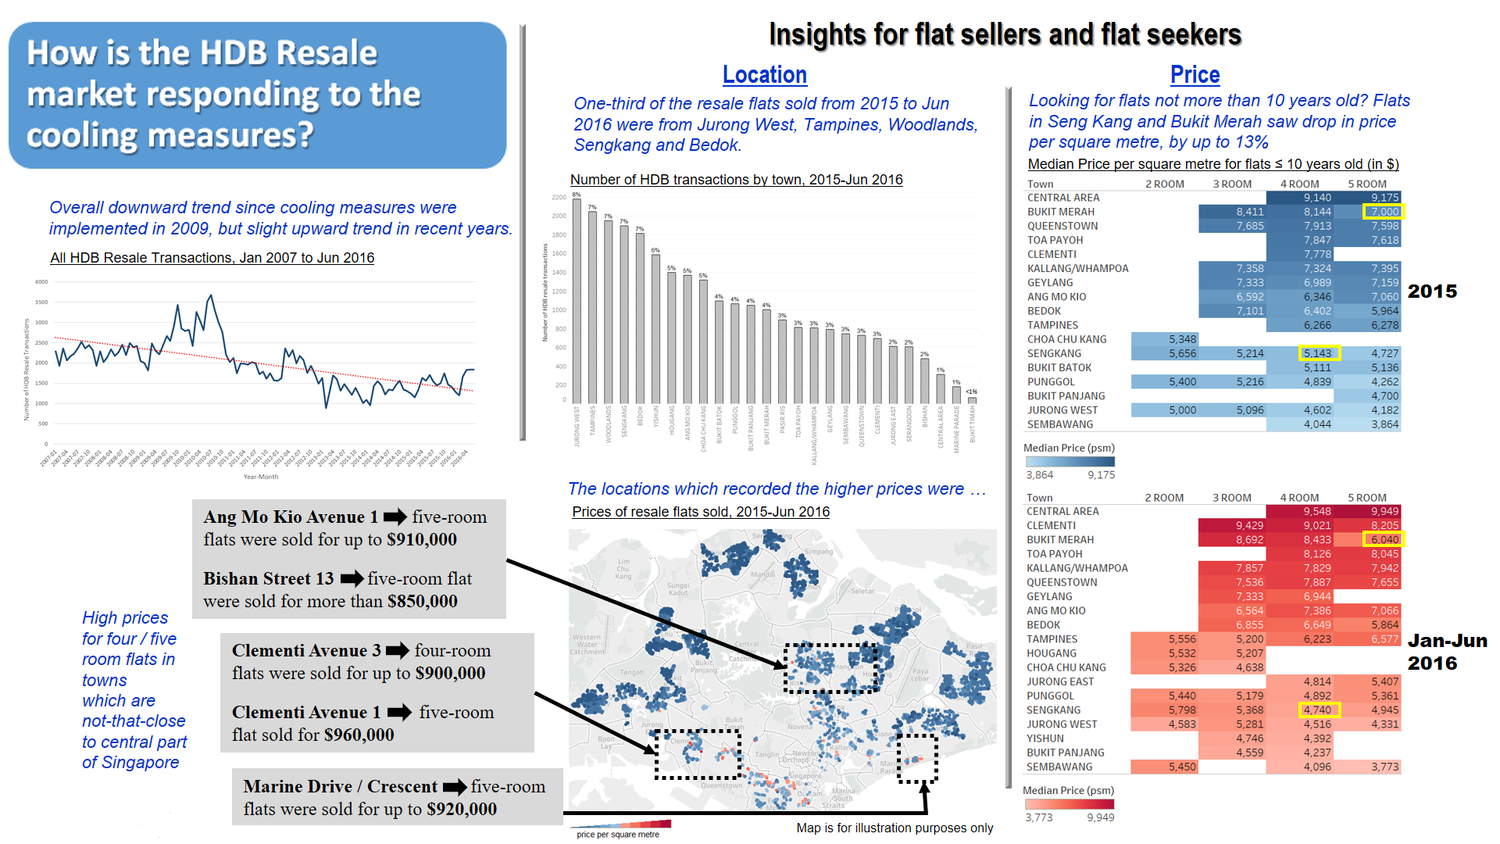
The infographics is designed to address similar questions by resale flat sellers and seekers. It tells the distribution of resale flats sold across Singapore, and highlights a few specific transactions which seem to be out-of-the-norm. There is also a specific section on median price per square metre by town in 2015 and 2016, so that flat sellers and seekers can do their own comparisons of the prices. The young (not more than 10 years old) 4-room and 5-room flats were specifically selected for this analysis, as such flats are typically the ones which are in demand.
