ISSS608 2016-17 T1 Assign1 Lee Mei Hui Cheryl
Contents
Abstract
This report aims to analyze the Singapore Public Housing Resale Market conditions in 2015 and the first half of 2016 through the use of visual analytics. Overall, it has been noted that
- In 2015 and 2016, most resale flats were 3-Room, 4-Room or 5-Room, with 2016 Q1 and Q2 showing more resales than 2015 Q1 and Q2 respectively
- Median resale prices since 2015 have remained relatively constant across all flat types with the exception of the multi-generational units
- Districts with the most number of flats sold were generally cheaper and vice versa
- Smaller houses had higher median price per square meter
Problem and Motivation
One vision that the late Prime Minister of Singapore, Lee Kuan Yew, had was for every Singaporean to have a home to live in. Hence, the government started the Housing Development Board to create affordable housing for the nation. However, with Singapore’s limited land space and increasing urban development, coupled with demand and supply at work, public housing in Singapore has faced steady increases in price over the years. To address this problem, the government implemented several property cooling measures since 2009 with notable success. However, how has this impacted our current property resale market?
This report aims to look specifically at the resale public housing market in Singapore for the year 2015 and 2016 in order to understand the following issues
- The share of resale public housing supply in 2015,
- The distribution of resale public housing prices in 2015, as well as
- Any patterns between the first half of 2016 and 2015 for the above findings
Approaches
HDB resale data was obtained from data.gov.sg and analyzed. The Resale Flat Prices data set selected covers the period of Mar-2012 to Jun-2016, but this report only focuses on data from 2015 and 2016. It also contained the following information that was utilized:
- Year-Month - Showing year and month of which the flat was resold
- Towns - District where resale flats were sold in Singapore
- Flat Type - Made up of 7 categories, where the more rooms a flat has, the larger the flat
- Storey Range - The floor range of which the flat was sold
- Floor area sqm - The area of the flat
- Lease Commencement Date - Year of which the flat finished construction and was sold
- Resale Price - Price at which the flat was sold
From the above data, extra fields were derived
- Year - Derived by splitting the Year-Month column into just the Year
- Month - Derived by splitting the Year-Month column into just the Month
- Month(group) - Derived by grouping each months into their respective quarters, Q1, Q2, Q3 and Q4
- Price/Area - Derived by taking (Resale Price) ÷ (Floor Area sqm)
Through the use of Tableau, the above data was analyzed and charts were created to show relationships and findings. Summarized results were then compiled into an infographic for easy reading. Detailed results can be found in the "Results" section below.
Results
General observations
General Observations can be found in the infographics attached
Explaining each observation
Resale Flats Composition in terms of Flat Type
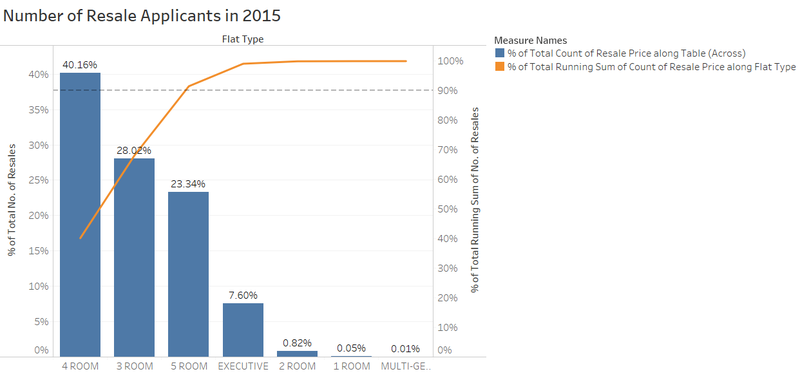
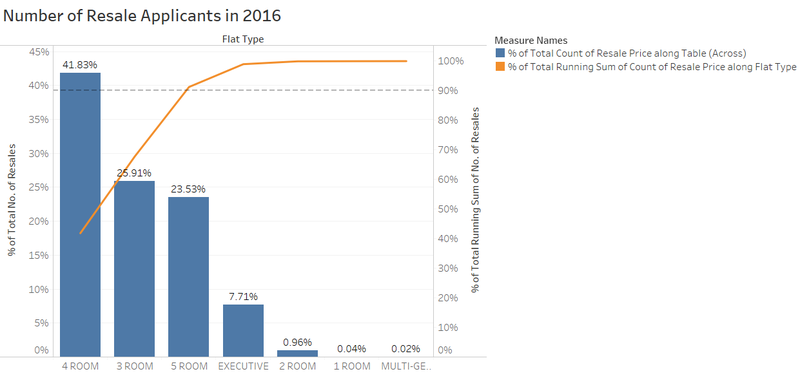
90% of all flats were made up of either 3-Room, 4-Room or 5-Room flats as evident from the Pareto Chart below for 2015 and 2016 respectively. This shows that as a whole, most Singaporeans living in HDBs live in 3/4/5-Room flats
Number of Resales
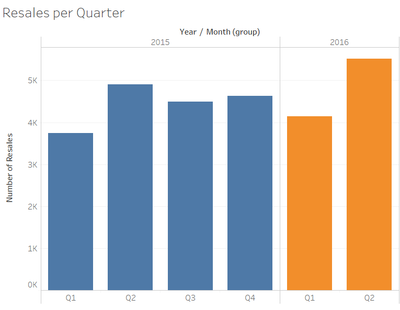
For 2015, the highest number of resales came from Q2. However, Q1 and Q2 resales for 2016 surpassed 2015 sales in the same quarters, which could be an indicator that the resale market has been picking up in 2016.
Lease Commencement Date
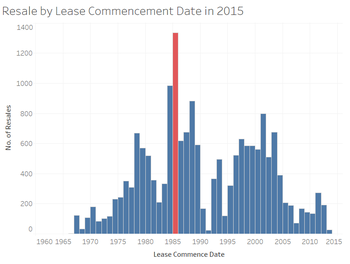
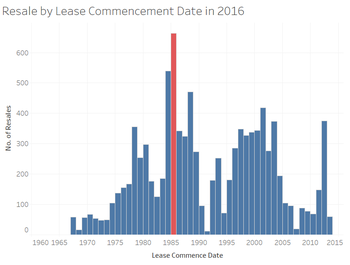
Surprising, when looking at the lease commencement date of all flats sold in 2015 and 2016, most of the flats had the lease commencement year of 1985 (red bar). This could be because there were more flats that were built that had the lease commencement date of 1985. However, based on flats construction figures from data.gov.sg, the year with the most number of constructions was 1984. Perhaps most construction was completed near year end, and majority of residents only shifted in during 1985.
Prices by Storeys
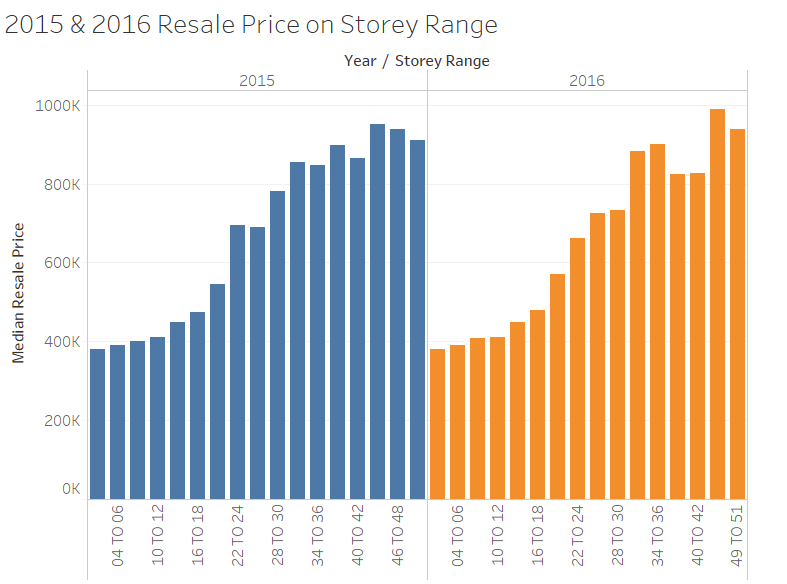
Higher level storey flats resold cost more than lower levels, and this is consistent across 2015 and 2016.
Median Resale Prices
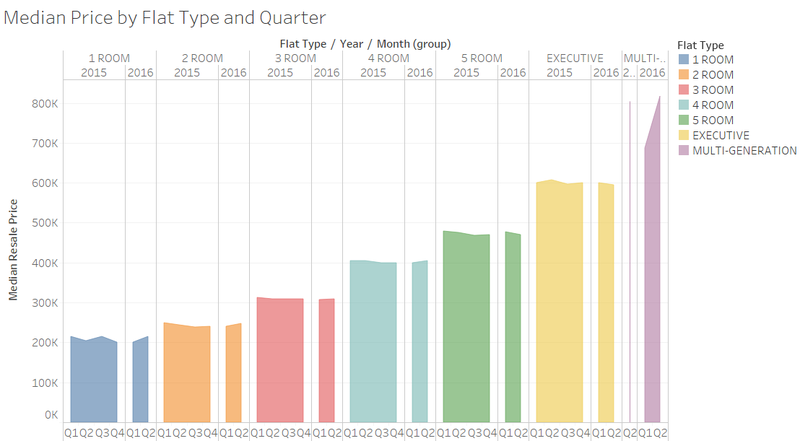
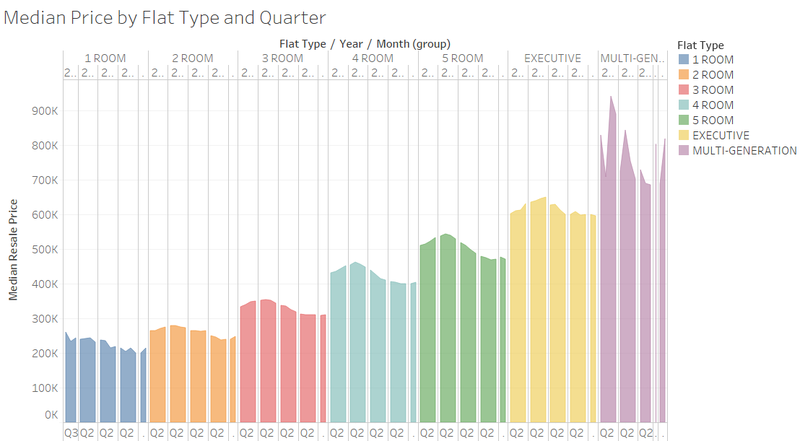
Median resale prices of flats across all types (except multi generational flats) remained relatively constant from 2015 to 2016. This conclusion cannot be made for multi generational flats because of its small data set from 2015 - 2016, with only 3 of such flats sold during this period.
However, median resale prices have been on a downward trend since 2012, as seen from the 2nd figure, and 2015 & 2016 mark the lowest since 2012.
Prices per Square Meter
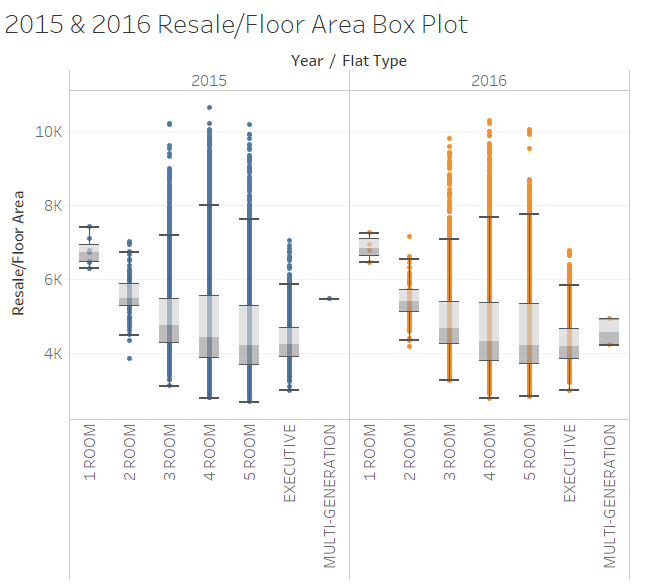
Another interesting observation was that median prices per square meter decreased with increasing size of the flat. This can be seen from the box plot, where the median price of 1-Room Flats are much higher than that of a 5-Room or Executive Flat.
Resale Flats and Location
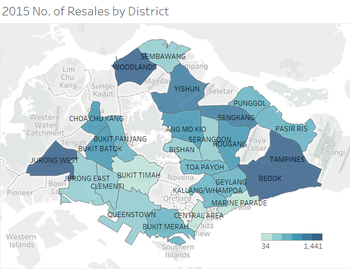
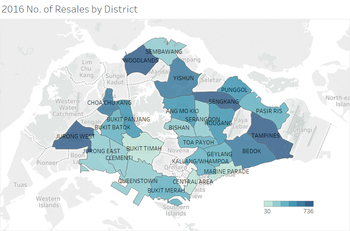
Most number of resale flats were sold in Jurong West, Tampines and Woodlands for both 2015 and 2016, as indicated by the darker blue regions in the map. These are generally the heartland areas away from the center of Singapore.
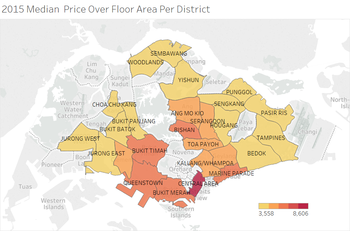
Conversely, the most expensive areas (measured by median resale price/sqm) were Central Area, Queenstown and Marine Parade in 2015, and Central Area, Queenstown and Bukit Timah in 2016. These areas are more toward the central district of Singapore. This is inversely proportionate to the map showing the number of flats sold, where the more expensive areas tend to have less units sold.

Conclusion
Overall, 2016 seems to be very much similar to 2015. However, the most notable difference is that there seems to be a trend of the market picking up in 2016. Perhaps this is a signal for those who are interested in purchasing to buy now before the price picks up. For the government, this also shows that cooling measures implemented previously have stagnated, and further measures might be implemented in future if prices are still above their target range.
