ISSS608 2016-17 T1 Assign1 Kuar Kah Ling
Abstract
An exploration into the trend of Singapore’s resale housing. In Singapore, it is said that approximately 80% of the population stays in public housing. As such, these charts are created to develop a more in-depth observation of what kind of trend or patterns Singaporeans may wish to take into consideration when purchasing a resale unit. The charts indicate a few variables such as geographical locations, flat types, storey level and how these variables can affect the overall pricing of the resale homes.
Motivation
As a young female adult living in Singapore, sales and resale of public housing is of personal interest. With the high inflation and high cost of living in Singapore, it is no doubt that most young Singaporeans and newlywed couples are struggling to find a place of their own to settle down. Even though key factors such as geographical locations are of importance, the fact ultimately lies with affordability. This study enables us to observe when in consideration of purchasing a resale home, which ones are the most ideal and affordable. On top of that, it also offers an estimated indication on whether the ideal resale housing could be a future investment asset.
Approaches
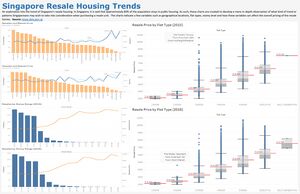
It is common knowledge that when it comes to properties, location is of utmost importance. Thus, I started my analysis by town in 2015 and 2016 (till June 2016) to find out which area had higher resale volume. The mean and median resale price line graph was added on top of the resale by town bar chart to show the their respective prices. While per-square-metre price is usually used for a more uniform comparison, I have chosen to use the absolute value as the overall affordability is the primary consideration.
Next, I zoomed into resales by storey level in 2015 and 2016 (till June 2016) as I wanted to find out which levels tend to resell more and if the floor level had any possible effects on the median resale price. Similar to the analysis by town, a bar chart and median line graph was used for this analysis.
Finally, I delved into resale price by flat type in 2015 and 2016 (till June 2016). There are many different flat models e.g. Model A, New Generation, Standard, etc. However, the general consideration when purchasing a resale flat is how many rooms it has. Hence, my analysis was by flat type and not flat model. A box plot was chosen for this analysis to better understand the spread of the resale prices by the flat type.
Tools Utilised
Tableau was mainly used to run the data.
For distinct outliers, annotations were used to provide details of the points. A clean white background and consistent colour palette of orange and blue was used to minimise distraction to the reader. Charts of the same analysis were given identical colours and arranged in a top-and-bottom manner for ease of identification and comparison. Commonly seen charts were used so that the infographic is easily comprehensible.
Results
It is important to note that the comparison between 2015 full-year and 2016 half-year is not a like-for-like comparison as we only have the half-year data for 2016 and there could be factors in the later half of the year which may impact the analysis. However, based on the current trends noted in the charts, the following could be observed.
Firstly, Jurong, Tampines and Woodlands are the top 3 towns and Central Area, Marine Parade and Bukit Timah are the bottom 3 towns by resale volume in both 2015 and 2016 (till June). No surprises there as, on page 8 of HDB Annual Report 2014/2015 (HDB Annual Report 2014/2015), it is stated that, Jurong, Tampines and Woodlands have the most number of public housing units while Central Area, Marine Parade and Bukit Timah (collectively known as "Other Estates") have the least number of public housing units.
Secondly, the mean and median resale prices by town for both years are of generally similar patterns. It is interesting to note that even though Marine Parade is part of the "Other Estates" of more limited public housing supply, its mean and median resale prices are significantly lesser than the other two "Other Estates" towns (Central Area and Bukit Timah).
Thirdly, the resale volume by storey levels have similar patterns in both years, with 4th to 6th floors having the highest resale volume. Median resale price is relatively constant across the 1st to 12th levels. The increase in median resale prices begins only from 13th floor onward. It appears that there is a premium for staying at higher levels. This makes one wonder if it is indeed the high floor level or the scarcity of resale volume that is driving the median resale price upwards.
Finally, for both 2015 and 2016 (till June 2016), the mean resale prices of 3-room, 4-room, 5-room and Executive are greater than their respective median resale prices. Among the four identified flat type, mean resale price for 5-room flats is most affected by the outliers as its mean is much greater than its median. Additionally, the spread of resale prices for Executive is smaller than that of 3-room, 4-room and 5-room flats. Two distinct outliers were noted. Namely, the 3-room terrace flat at Kallang/Whampoa in 2015 and the 2-room standard flat at Bukit Merah in 2016. However, a general healthy upward resale price trend still exists across the flat types.
