ISSS608 2016-17 T1 Assign1 Chen Yi Fan
Contents
Abstract
Singapore is well-known by its success public housing policy which has made impressive progress to change Singapore from “one of world’s worst slums – ‘a disgrace to a civilised community’” commented by British Housing Committee Report in 1947, to a country that more than 80% of population live in HDB (Housing and Development Board) flats, with 95% of them owning their HDB flat[1] .
Problem and Motivation
House is one of the essential needs for everyone. In Singapore, the resale HDB flat, as readily available and wider selection options, plays an important role in the housing market especially for the families who want to settle down in a relative short time frame at an affordable price compared to the cost of the private houses.
Through this exercise, we would like to find out what are the overview of the resale flats market in Singapore in 2015 as well as compared to year 2016. For a house buyer, the first few questions might come up are:
- What are the houses available in the market?
- 1) What are the house sizes available?
- 2) In which areas I should look for?
- 3) When was the flat built?
- 4) How big is the flat do I want to buy?
- What are the prices of the houses?
- 1)What is the current trend of resale flats price compared to the past years?
- 2)Which areas’ house prices are more affordable?
- 3)How does the floor level affect the house prices?
- How do the above factors reflect in this year (2016) as compared to last year?
And so on, however, we focus mainly on the most pertinent questions as following:
- Number of flats supplied vs type of the flats;
- Number of flats supplied vs their locations;
- Number of flats supplied vs their age;
- The flat sizes available in the market;
- The price of flats vs their year of sale;
- The price of flats vs their locations;
- The price of flats vs their floor level.
The answers of above questions will help the buyers to make their decision on a resale flat quickly and precisely, in order to suit for their diverse needs.
Approaches
To answer the question of what are the houses available in the market and what are the house sizes available, we will use the Number of Resale Applications Registered by Flat and HDB Resale Price Index downloaded from data.gov.sg to give an insight to the resale flat market in Singapore.
Trend Analysis on Number of flats
Number of flats supplied vs type of the flats
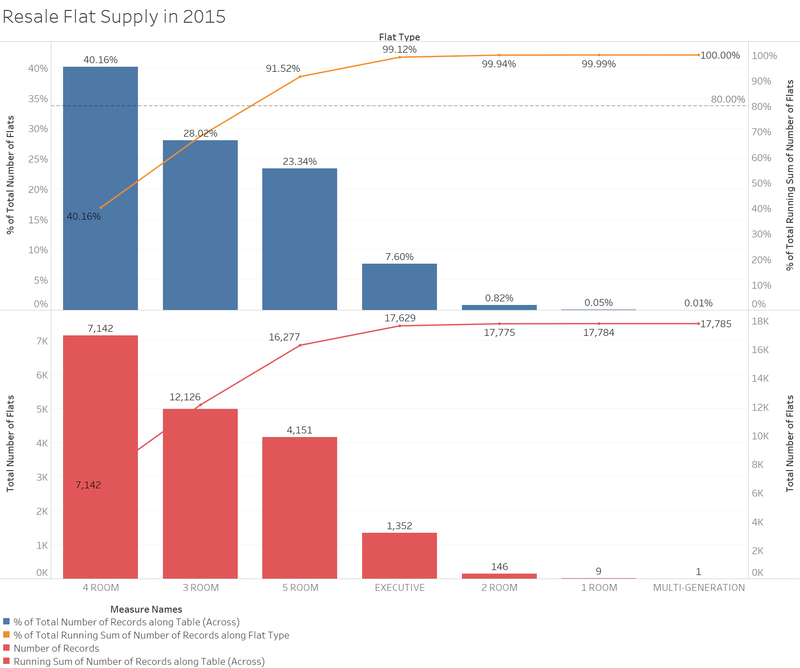
From the Pareto chart shown below, we can observe that among all the7 types of the resales flats in year 2015, namely 1 to 5 Rooms, Executive and Multi-generation flats, 3 to 5-Room flats contribute 91.52% to the total resale flat market. Especially 4-Room flats with the total number of 7,142 out of all 17,785 units dominant majority portion of the resale market at 40.16%. It followed by 3-Room and 5-Room flats with 28.02% and 23.34% shares respectively.
Pareto graph is used here since it is able to clearly display the distribution for each of the resale flats type. And the 2 charts showing in blue and red colour display the running total by percentage and number of count.
Number of flats supplied vs their locations
Next, after we understand the flat types available in the market, where are these flats located?
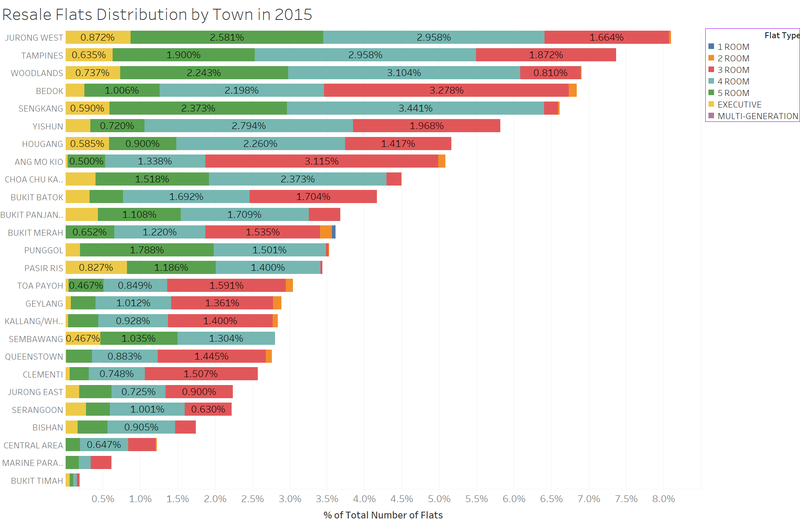
From the overview, we can see that Jurong West provides most of the resale flats (8.102%) followed by Tampines (7.366%) and Woodlands (6.905%) in year 2015, whereas Bukit Timah is hardly to find resale flats (0.191%).
These are the distribution for each of the flat type:
| Flat type | Town with most resale units registered | % among all units with the same flat type |
|---|---|---|
| 1-Room | Bukit Merah | 0.051% |
| 2-Room | Bukit Merah | 0.157% |
| 3-Room | Bedok | 3.278% |
| 4-Room | Seng Kang | 3.441% |
| 5-Room | Jurong West | 2.581% |
| Executive | Jurong West | 0.872% |
| Multi-Generation | Bishan | 0.005623% |
Stacked bar chart is used here to better differentiate flat types as well as to give the overall picture of the contribution from each residence area.
Number of flats supplied vs their age
Another important aspect we will be looking at is how old is the flat.
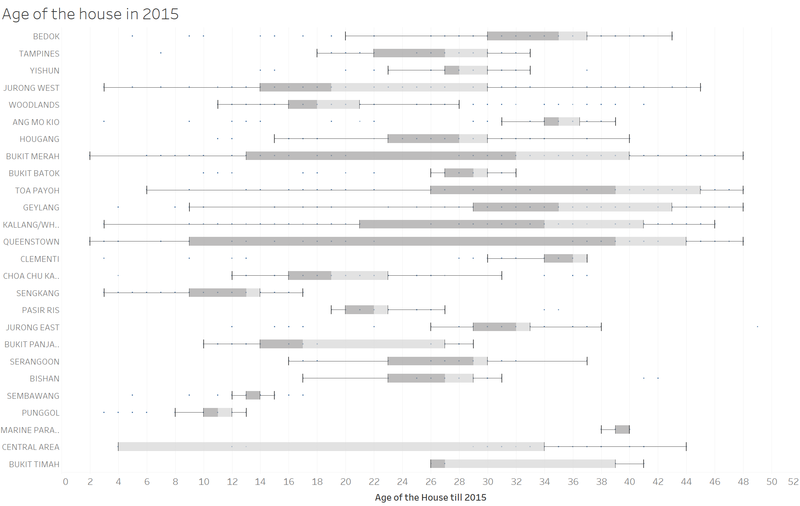
From the box plot chart shown below, we can see Queenstown and Toa Payoh has a wide range age of the flats and relative older flats with the median age at 39 years. Marine Parade also has the same median age flat of 39 years but it is concentrate at this range. On the contrary, Punggol, as one of the new towns, has the flats of median age at 11 years by the year of 2015.
To derive the age of the house, a calculated field is created to find the difference from the flat’s lease commence date till 2015.
The flat sizes available in the market
Another important question a buyer might want to know is how big of the flat he/she is looking for?
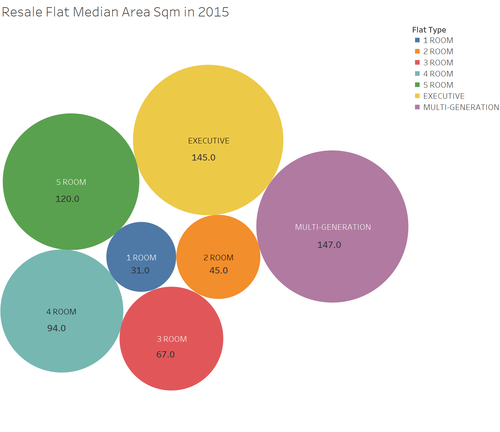
To avoid any possible skewness introduced by outliers to affect the floor size of the flats, we use the the median value for each of the flat type. They are shown in the bubble chart below.
It is clearly indicated multi-generation is the largest flat with median floor size of 147 m2 and 1-Room is the smallest flat with median floor size of 31 m2.
The bubble chart is suitable for this analysis since there is only one metric to measure, floor area in square meter, by each of the flat type. The colours distinguish each type clearly.
Trend Analysis on Flat Price
The price of flats vs their year of sale
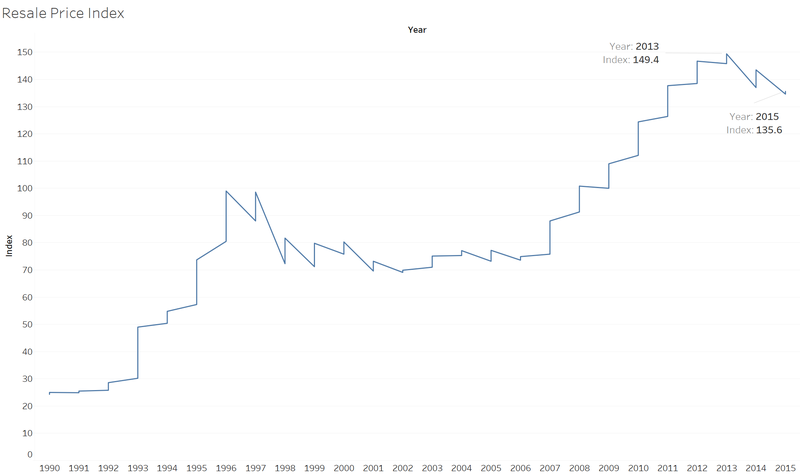
Singapore government has been taking measures to maintain the house pricing stable although we can still feel the hot of the property market in recent years. To have a better understanding of the house pricing, let’s start from the resale price index obtained from the resale price index provided by HDB.
The dataset covers the resales price index since 1990. We can see from the line chart below, the resale price in 2005 is in a downward trend after the peak in 2013.
The line chart is used here to show the moving of the resale price index over the years. It enables us to identify the key turning points such as the peak in 2013.
Next, we will look specifically the resale flat market in year 2015.
The price of flats vs their locations
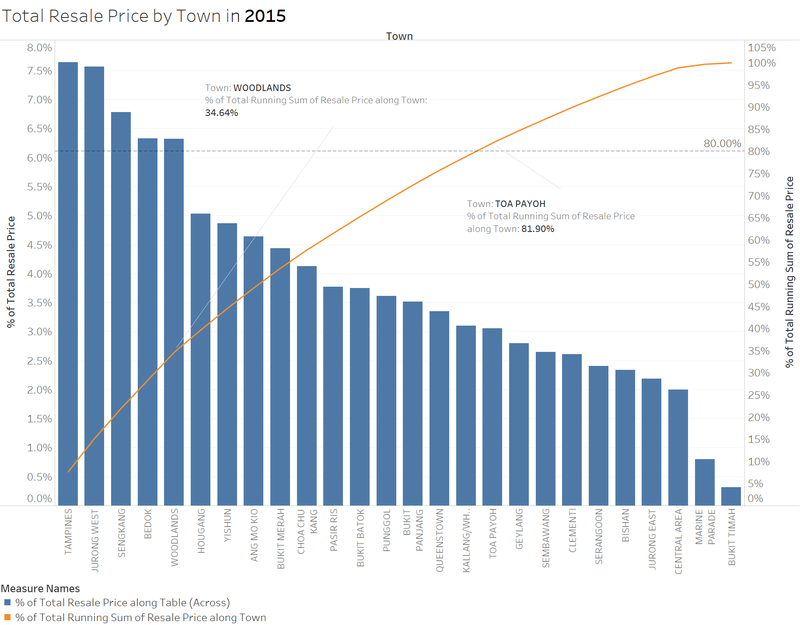
Firstly, for the whole resale flat market, we can see from the Pareto chart below, 80% of the total resale comes from about half of the towns, i.e. 24 out of the total 52 towns. Among the 24 towns, 5 of them, Tampines, Jurong West, SengKang, Bedok and Woodlands have the top sales which contributes 34.64% to the total sales.
The Pareto chart is used here to show the sales contribution by each town and the reference line at 80% helps to identify the proportion of the main contributors.
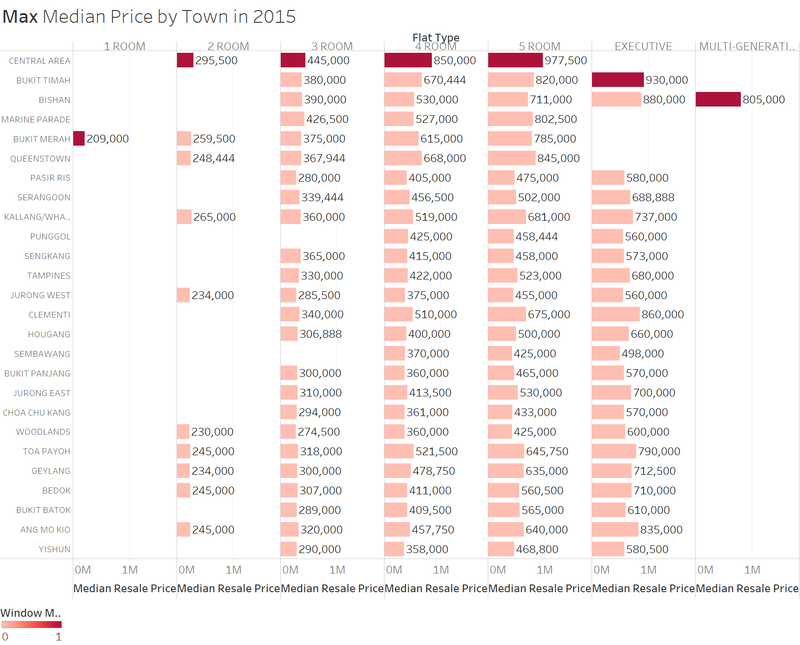
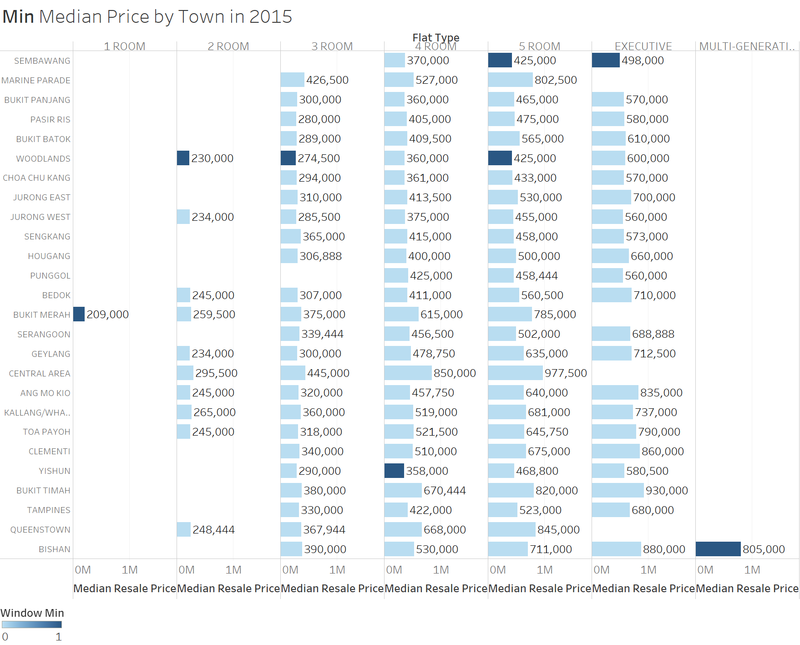
Further study is carried out followed by the overview above. Here we want to find out which area's flat prices are the lowest or highest in the market. The following 2 bar charts may answer the question.
From the first chart, we can see 5-Room and Executive flats are least expensive in Sembawang. The cost of the 5-Room flat in Sembawang is about the price for a 3-Room flat in Marine Parade. 2-Room, 3-Room and 5-Room resale flats in Woodlands are at the lower end. And the median price for 5-Room in both Sembawang and Woodlands are the same which S$425,000. For 4-Room flat, buyers may find the most economic unit in Yishun. 1-Room is only available in Bukit Merah and same as for Multi-generation unit in Bishan which both show the lowest price. However, they may not represent the market trend given the fact both flat types are only available in a single area.
Similarly, in the next chart, we can conclude that central area is the most expensive market for 2 to 5-Room resale flats. The top median price for Executive is at Bukit Timah. As discovered in the minimum median price chart above, Bukit Merah and Bishan show both the lowest and highest price for 1-Room and Multi-generation since they can only be found in these 2 areas.
The price of flats vs their floor level
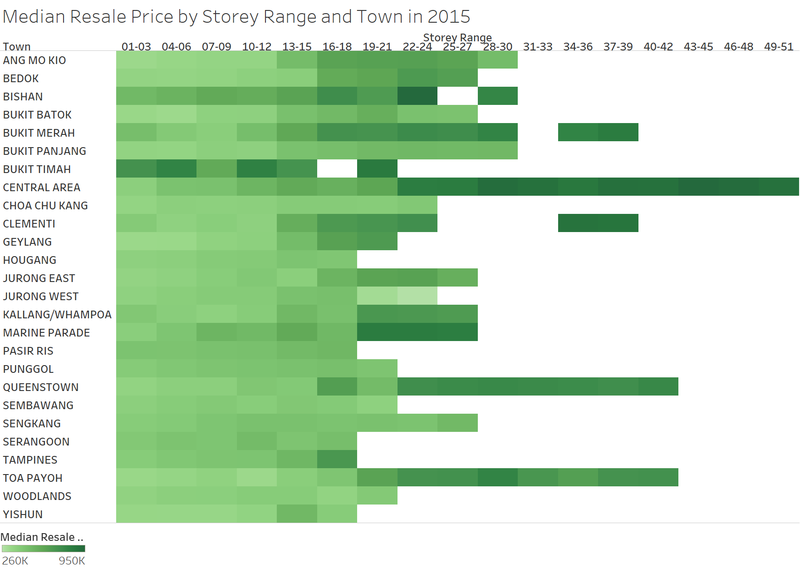
Storey level is another important factor to be considered when buying a house. Higher floor usually cost more. From the stacked bar chart below, a few points could be discovered.
Central area has the highest floor units which can be as high as 50 levels. Except for Bukit Merah, Clementi, Queenstown and Toa Payoh which have houses up to about 40 storeys, other towns’ usually have resale flats ranging from 20 to 30 stories. In general, the higher floor appears darker color which means higher median price. Nevertheless, we could discover some exceptional cases. For example, in Bishan, 22-24 storey units have higher median price than 28 to 30 storey units.
We used bar chart to represent each of the district. The stacked bar char here will be better to demonstrate the gradually progress of the median price from lower to higher storey units.
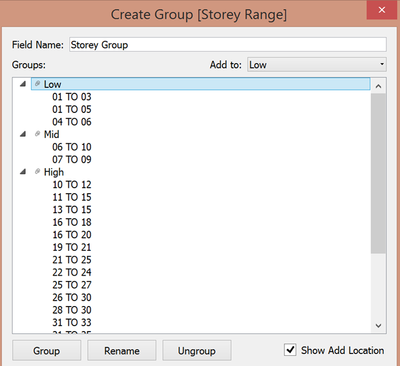
In the next chart, we group the floors to Low (1 to 6), Mid (7 to 9), High (9 above). By plotting the Flat Model by storey group, we can see that Type S2 flat is always the most expensive flat model no matter whether it is in low, mid or high floor.
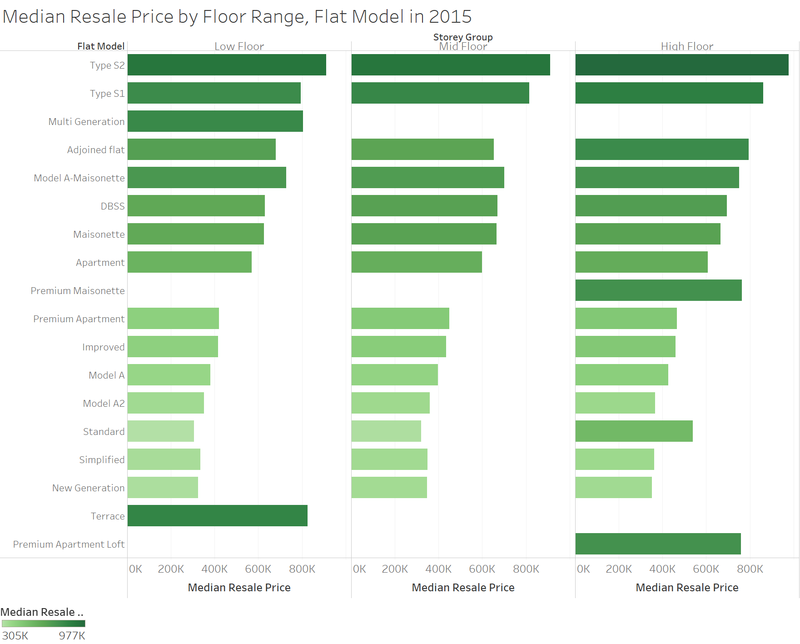
Bar char is appropriate for this analysis since it does not make the chart too cluttered yet can highlight the difference using lighter to darker tone of the color. Stacked bar chart is unnecessary since there are only 3 group of storeys which will be clearer to display separately.
To prepare the chart above, group function is used to simplify the storey levels as shown below.
Compare the patterns of the first-half of 2016 with the patterns of 2015
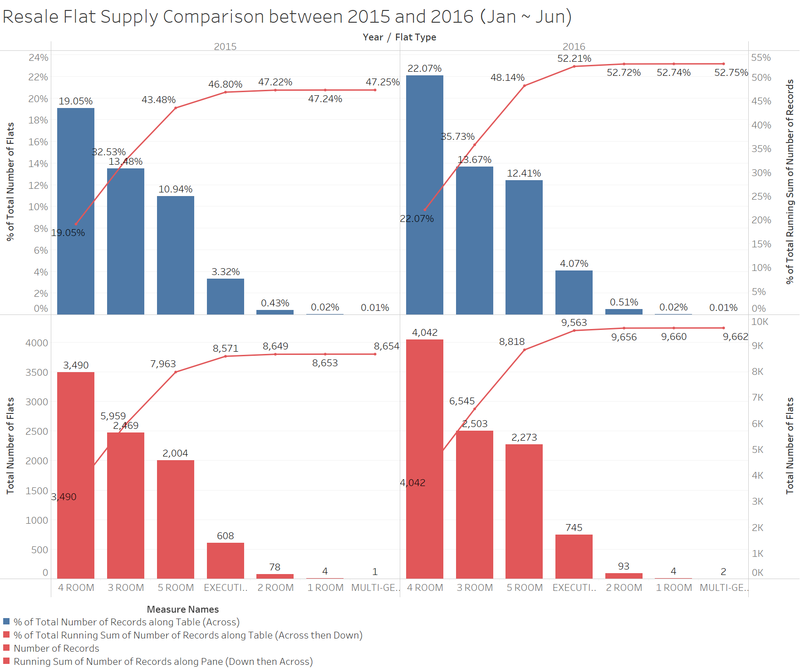
In the next chart, we compare the resale flat supply in 2016 first 6 months to the same period in 2015. In the first chart, we can see 4-Room flat increases 3.02% from last year 19.05% to 22.07% in this year. Similarly the total supply for the other flat types also increase except 1-Room and Multi-generation remain the same. As a result the total number of resale flat increases 5.5% in the first half of year 2016 compared to the same period of the last year.
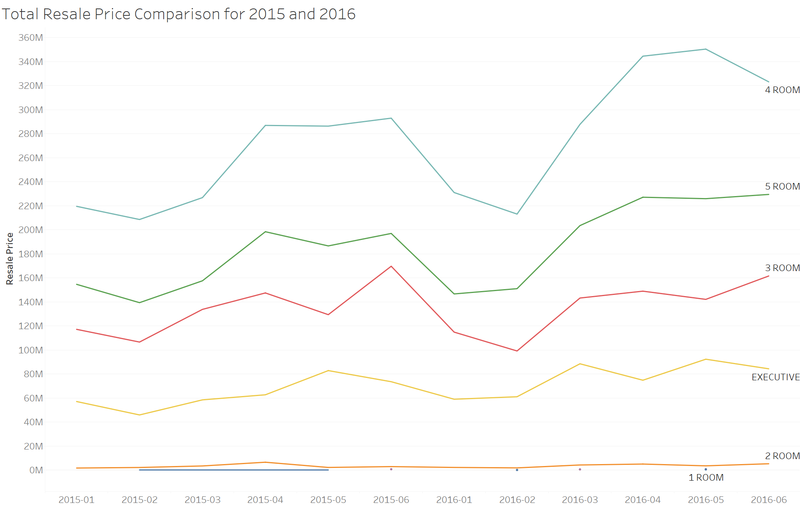
Similar as the supply quantity, resale flat total price also increases in 2016, especially for 4-Room and 5-Room flats. There is a significant increase from March. But there is a drop in June for 4-Room and Executive flats.
The stacked line chart clearly tells the upward trend of the total resale price. Different flat types are also represented by different coloured lines.
Tools Utilised
Tableau v10.0
Piktochart
Results
From our analysis above, we can conclude that
- 3 to 5-Room flats contribute over 90% of the resale market. Among them all, 4-Room has the biggest share in 2015 and first half of 2016;
- From volume perspective, Jurong West, Tampines and Woodlands are the top 3 districts which has the most number of resale flats.
- For the most common flats, Bedok has most 3-Room flats, Sengkang has most 4-Room flats and Jurong West has most 5-Room as well as Executive flats.
- In terms of sale price, Sembawang and Woodlands are the top 2 districts which provide most affordable resale flats. Central Area is the most expensive district for resale flat market.
- Flats in Queenstown, Toa Payoh and Marine Parade have the highest median age at 39 years whereas it is only 11 years in Pungol.
- Compared to 2015, the resale flats increase in number of sales and total resale price in the first 6 months of year 2016.
