ISSS608 2016-17 T1 Assign2 Ong Han Ying - Data Preparation
|
|
|
|
|
|
|
|
|
|
|
| CONTENT |
|---|
|
Section 5: Data Preparation |
Section 5: Data Preparation
"Flawed data can guide even the greatest leaders to the wrong conclusion". Evaluating the results of an online survey is tricky because the quality of the results is highly dependent on the quality of the survey's questions, and also; the responses from the respondents. Therefore, is it essential to prepare the data well such that the quality of the analysis, later on, is precise. The strategy to prepare the data as below;
5.1: Source of Dataset
The sources of the dataset used, as below;
- Wiki's Online Survey Results
- Survey Questionnaire Master - Manual database created based on information from;
5.2: Best Practice to Evaluating Results of Online Survey
It is important to evaluate the methodologies to analyze the survey data, especially so when the quality of the analysis is highly dependent on the quality of the data and data interpretation. As such, with reference to the various online searches, and guidance from the course instructor; the following are attempts to identify common mistakes, and then; to overcome these mistakes in the subsequent sections.
5.2.1: Common Mistake 1 - Using Arithmetic Mean
It is a common (and yet a critical mistake) for people to analyze results on a Likert Scale, and treating it like a continuous data. This is wrong because it implies that there is a measure of distance between values. For instance, it is not logical to say that "3 - neutral" is 3 times the feeling of a "1- strong agreement". For instance, 100 respondents giving a score of 3 tell a very different story as compared to 50 respondents giving a score of 5, and another 50 respondents giving a score of 1, yet; both situations will result in a mean of 3. [[1]]
Thus, converting ordinal labels to the number can cause misleading results. Likert-type data has to be treated as ordinal data. Therefore, it is essential to re-code the numerical number results from the survey back to its labels since,
- Using numbers can lead to misleading results - by doing a sum/average of the scores
- When interpreting the results, it is often common for the reader to forgot if 1 is assigned to "Strong Agree" or "Strong Disagree", and therefore, then to refer back to the scale again.
As such, renaming the results which the label will help to overcome the above problems. This is will be completed in section 5.4.1.2: Consistency of Data.
5.2.2: Common Mistake 2 - Inconsistent Order to the Questions
Next, it is important to ensure that the order of the questions is consistent throughout the survey. If not, there will be a risk of confusing the respondents and collecting data that doesn't represent their true feelings. As such, it is essential to check both (1) the order of the questions (1 to represent XX, and 5 to represent XX on the scale), and the polarity of the question.
This is will be completed in section 5.4.1.3: Accuracy of Data.
A check over the questions in the survey has found that none of the questions in the database has made such a mistake. Therefore, all the questions can be included in the analysis of the results later on.
5.2.3: Common Mistake 3 - Asking Compound Questions
Asking "Compound Question" is another common mistake that is made in the designing of market survey. For example, "The use of Wikipedia improves student's learning, and is useful for teaching" - is a compounded question because it forced the respondent to give a single answer to reflect his/her feeling on both "student's learning" and "useful for teaching". This is a serious mistake because it leads to the false interpretation of the results.
A check over the questions in the survey has found that none of the questions in the database has made such a mistake. Therefore, all the questions can be included in the analysis of the results later on.
5.2.4: Common Mistake 4 - Allow Neutral or NA Responses
Last but not least, while it common to feel the need to force a respondent to give an answer, however; doing so may "pollute" the data with an unreal answer. Thus, while it seems undesirable to let respondents give an "NA" or "Neutral" response, but doing so; it can improve the quality of data instead.
A check over the order of the questions in the survey has shown that by applying the Likert Scale, an "NA" response is allowed at "3"; and this is consistent throughout the survey questions. Therefore, all the question can be included in the analysis of the results later on.
5.3: Evaluation of Tools for Data Preparation
With many tools around, we have compared the common tools, and select the final tools for data preparation, as below;
Note: "X" refers to the software is able to fulfill the task at ease (within 5 - 10 clicks)
| Function Required | Tableau | JMP | MS Excel |
|---|---|---|---|
| Splitting of Data into column | |||
| Summary of Data Statistics (to identify missing value(s)) | |||
| Replacing of data across columns | |||
| Recoding of Categorical Data | |||
| Join Tables | |||
| Integration with other visualization tools |
As a result, we will primarily be using JMP to prepare the datasets. Upon completion, the dataset will be exported out from JMP as a .csv file and saved as a separate dataset to be used in various visualization tools in the later stage.
5.4: Data Preparation Implementation
5.4.1: Dataset 1 - Survey Results
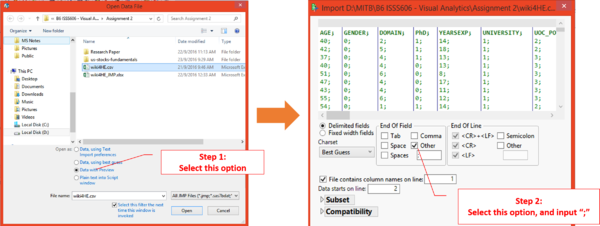
Firstly, the data file, "wiki4H.csv, is imported into JMP, by conducting the following steps;
5.4.1.1: Completeness of Data
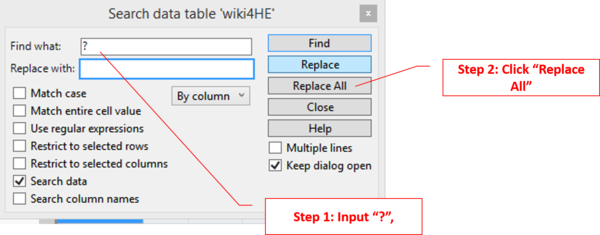
In order to check for completeness of data, we have to replace missing value of "?", with " " (Blank) in JMP, as below;
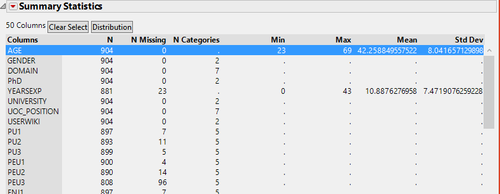
This will then generate a statistics to identify the missing value, as below;
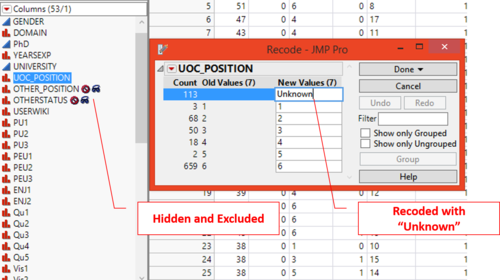
With the above finding, we will
- Keep the field "UOC Position", because this is an important information to identify the background of the respondents. Missing value will be recoded with "Unknown" instead.
- Exclude "Other_Position", and "OtherStatus" since there is additional information for "UOC_Position", and "UOC_Position", also; there have more than 25% of missing data.
Output:The results as below;
5.4.1.2: Consistency of Data
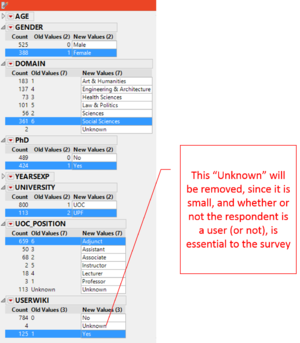
Next, we will check the consistency of the data. Other than the survey results for each of the survey question, the dataset contains other relevant information about the respondents. Using name labels work better visually as compared to using numerical labels, as per dataset. Therefore, the categorical data that are related to the information of the respondents are recoded. The summary of the actionable as below;
| No. | Field Name | Type of Information | Actionable |
|---|---|---|---|
| 1 | AGE | Respondent's Profile | |
| 2 | GENDER | Respondent's Profile | Change to Nominal, and recode it with "Male"/"Female" |
| 3 | DOMAIN | Teaching Background of Respondent | Recode it with respective definition based on Research Paper |
| 4 | PhD | Teaching Background of Respondent | Recode it with "Yes"/"No" |
| 5 | YEARSEXP | Teaching Background of Respondent | |
| 6 | UNIVERSITY | Teaching Background of Respondent | Recode with respective definition based on "Attribute Information" on the webpage |
| 7 | UOC_POSITION | Teaching Background of Respondent | Recode with respective definition based on "Attribute Information" on the webpage |
| 8 | USERWIKI | Teaching Background of Respondent | Recode with respective definition based on "Attribute Information" on the webpage |
The output as below;
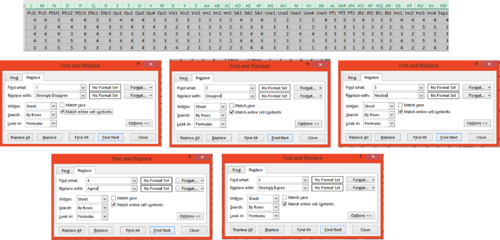
Next, referring to 5.2.1: Common Mistake 1 - Using Arithmetic Mean, we will replace the numerical value of the survey results, with the description instead of 1- Strongly Disagree 2- Disagree 3- Neutral 4- Agree 5- Strongly Agree
Since there is a total of 41 questions / fields affected. We will then save the JMP file as, "wiki4H_Step1_ClearedfromJMP.xlsx", and proceed with the cleaning of the data in the excel file, as below;
The file is saved as "wiki4H_Step2_Final.xlsx".
5.4.1.3:Accuracy of Data
Different Order of Question:
With reference to 5.2.2: Common Mistake 2 - Inconsistent Order to the Questions, it is essential to check for the order of the survey orders, and the polarity of the questions. Reading through the survey question, QU4 was spotted to show negative polarity to the statement. Since
- we cannot assume that "disagree" with the statement of "Wikipedia has a lower quality", is the same as "agree" to the statement that "Wikipedia has a high quality"
- There are sufficient questions (a total of 4, excluding QU4) under this section of "Quality".
We shall exclude the results from QU4, in our analysis, and the column shall be removed.
Same Option Selected by Respondents Throughout the Survey:
Next, we will also examine the accuracy of the submission in excel. An assumption can be made that if the respondents have submitted the same answer throughout the 43 questions, then; it is likely that it is not a real feeling because it is unlikely for a person to be 100% feeling the same throughout the question, especially so when there is a question of QU4, that show negative polarity of the question.
Thus, the identified 5 rows of data will be removed.
Similar Type of Questions:
"Use Behavior" and "Experience" have the similar question posted, and it does not make sense to have a respondent to "Agree" with the question in "Use Behavior", and on the other hand, "Disagree" in question in "Experience". For instance, if a respondent agrees with "I use Wikipedia to develop my teaching material" (Use Behavior), but he/she should not disagree with "I consult Wikipedia for the issue related to my field of expertise".
Since "Use Behavior" is used in the Research Paper, we shall exclude the use of results from "Experience" in the analysis.
5.4.1.4: Final Output of "Survey Result" Table
�A final check on the results of the data preparation of this table has shown that the total number of rows has reduced to 904, and 5 categories of survey result.
The file is then exported, and saved as "wiki4H_SurveyResultTable_Final.xlsx". Ready for use later.
5.4.2: Survey Question Master
Next, a manual table was created, so ask to help to
- Design the dashboard such that the question will appear, upon selection; so that the audience can relate the results to the question.
- Categorize the survey question, based on the category name assigned to the survey question
- Identify if the question is being used in the analysis of the survey results, with reference to the research paper.
| Field Name | Type | Header text | Description | Source |
|---|---|---|---|---|
| Qn_Code (Raw) | Input | Survey's code and question, per copied from website | NA | Original Data copied from the website |
| Category | Input | Category of the Question | NA | Original Data copied from the website |
| Qn_Code | Calculated | Survey's Question Code only | =TRIM(LEFT([Qn_Code (Raw)],FIND(":",[Qn_Code (Raw)])-1)) | |
| Qn_Details | Calculated | Survey question only | =TRIM(RIGHT([Qn_Code (Raw)],LEN([Qn_Code (Raw)])-FIND(":",[Qn_Code (Raw)]))) | |
| Research_Paper | Input | If the survey question is used in the research paper | NA | With reference to page 4 & 8 of Research Paper |
Note: Survey Qn, "VIS3 - I Cite Wikipedia in my academic papers" is re-classified under "Quality" instead of "Visibility" because it measures more of the quality of the Wikipedia article instead of visibility. For instance, an article is cited most likely because it is relevant, rather than it is being searchable. Also, citing an article acts as a source of endorsement on the article also.
The file is then saved as "Survey_QN_Master.xlsx". Ready for use later.


