Approaches
|
|
|
|
|
Contents
Identify significant IDs
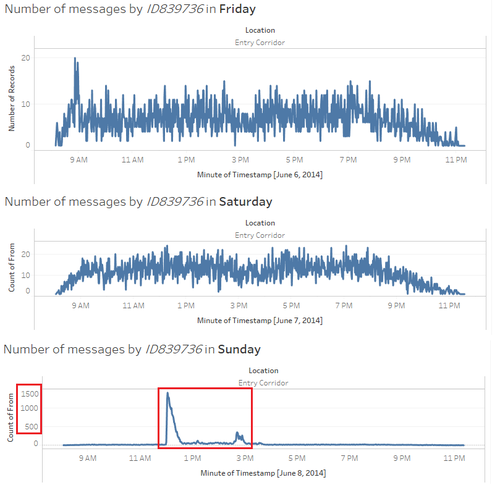
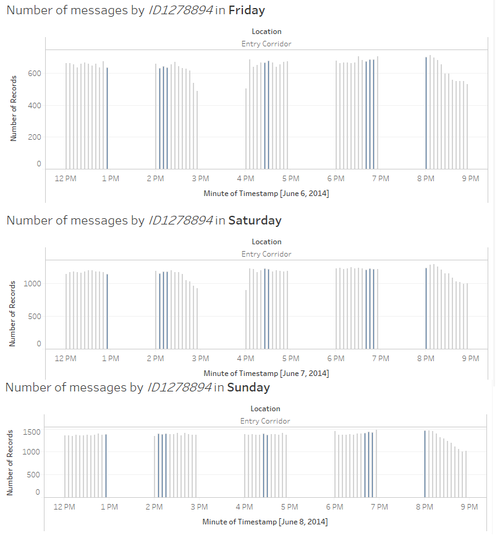
In order to detect each visitor’s communication situation, I calculated the number of messages which each ID received or sent a day. Then built a bar chart to show those numbers. As the following figures shown, there are three significant IDs which had extreme large volumes: 839736, 1278894. Compare the above graph with the below graph, I noticed that nearly 85% visitors received messages from 839736. In addition, ID 839736 and 1278894 both sent messages only from the entry corridor. On basis of these findings, I can identify these two IDs are service ID and belongs to the theme park.
ID 839736
I filtered ID 839736 to observe its time series in three days. I noticed that at 9 a.m. to 10 p.m. ID 839736 continued to connect with visitors and the number of messages was slightly different in Friday and Saturday. However, the number become very weird which was significant increased at around 1400 at 12 p.m. and around 250-350 at 3 p.m. to 4 p.m. Why service ID sent and received such large amount of messages? I assumed there may was a terrible accident happened at Sunday afternoon.
ID 1278894
Like the method of observation of ID 839736, I built three bar charts of the number of messages by ID 1278894 in three days. We can find an interesting thing that ID 1278894 sent a large number of messages to visitors every 5-minutes interval in an hour and rested next one hour but then it would continue to send messages with 5-minutes interval. This ID did the loop from 12 p.m. to 9 p.m. each day. In addition, ID 1278894 didn’t like ID 839736 that had a significant peak in Sunday. So in my opinion, though both ID 839736 and 1278894 are park service IDs, they have different functions and send different messages. ID 839736 is more like a help ID, and ID 1278894 is more like a real-time information update service ID.
Communication patterns
Scott Jones Pattern
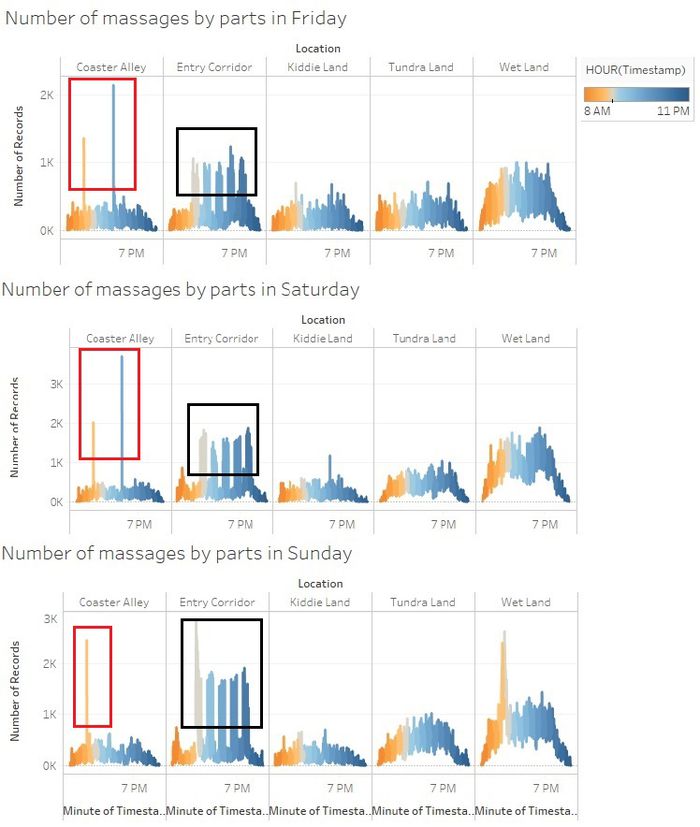
Used Tableau to build a line chart about the number of messages by different locations at each minute in three days. I divided time into two parts, one is morning which is yellow and the other is afternoon and evening which is blue. As for 12 p.m., it is grey.
From the following graph, look at the three red rectangles, we can see that there are two significant points at 11 a.m. and 4 p.m. in Friday and Saturday and one point at 11 a.m. Sunday. What’s more, those large amount messages all sent from coaster alley. A big stage in that location which have a two special showcase shows daily about an international superstar Scott Jones. The Scott Jones shows at 11 a.m. and 4 p.m. each day in June 6-8. So we can see that at that two time, the number of messages sent from coaster alley is significant large.
Accident Pattern
From 2.1. pattern, we can find that in Sunday, the peak number of messages in coaster alley was not like other two days. There is just one peak time in Sunday at 11 a.m. What’s more, the figures also show peaks at 12 p.m. in entry corridor and wet land which is really weird because there were two Scott Jones shows each day. Why the peak disappeared at 4 p.m.? It must have an accident about the show, so the peak was gone.(The detail can refer to the part 3.)
Play Game Pattern
Look at the three black rectangles in the below figures. From 12 p.m. to 9 p.m., significant points showed at five minute intervals every day in entry corridor. In DinoFun world, each visitor has DinoFun World app which provided a Cindysaurus Trivia Game. Joining the game can win fabulous prizes, so I can image that many visitors would like to join this game. In addition, those messages were from ID 1278894. Thus, those points represent that tests were sent by DinoFun World app at five minute intervals.
External Pattern
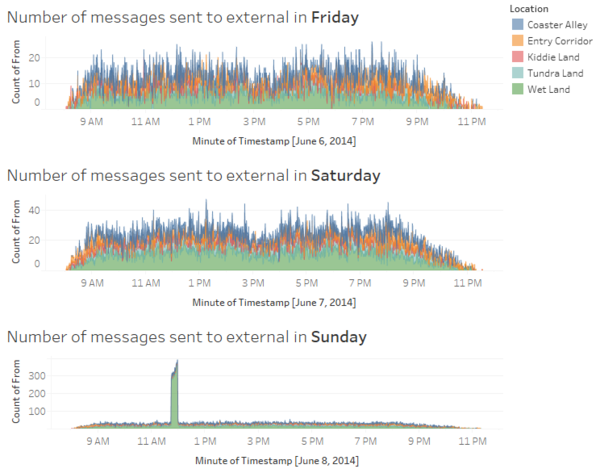
In part 1, we find that the largest number of messages were sent to external. So I filtered those messages which was sent to external from different IDs. Then counted them by different location and time. The graph as followed:
I noticed a very interesting thing that in Sunday, we can see that there is a very significant peak at 12 p.m. which totally different from the first two days. In general, the tendency in three days is supposed to be similar, however, the third day figure shows a special pattern. What’s happened in theme park that made the number of messages sent to external exploded at 12 p.m. in Sunday? I think maybe it was related with part 2.3. accident pattern.
Play alone Pattern
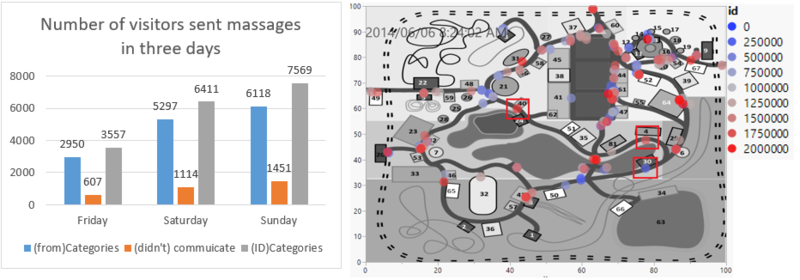
I used part 1 data to build a bar chart. From following graph, we can see that there are total 14365 (2950+5297+6118) visitors in community while 3172 (607+1114+1451) visitors didn’t sent any message in three days which means they didn’t use app to connect with other visitors. Next, I picked up those “lonely” visitors to observe their movement. Because there are many IDs playing together as a group in which someone didn’t have to send texts, they could just talk with each other. So I’d rather to find truly lonely visitors who really enjoyed by themselves. Fortunately, I do find some IDs. Like ID 1233488, 398504, 1906453, 1314513, 1288670, 1930644 etc. in Friday.
Group Pattern
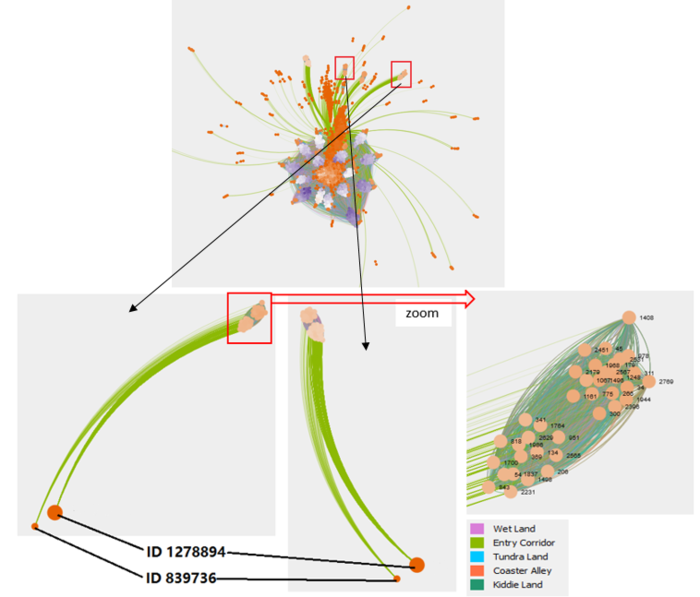
As part 2.6. said, there are some IDs forming one or two groups and they shared information just within their groups besides connected with park service IDs (ID 839736, 1278894). Like the following images, I selected 4 groups and zoomed two groups. We can see that those two groups had two communication patterns. One is sending messages within groups, the other is connected with another group which means that their communication range just between those two groups.
Vandalism
Actually, from part 1 and part 2, we found that, there was certainly an unexpected issue in the theme park at Sunday afternoon. In Sunday afternoon, the number of messages sent to ID 839736 and external increased dramatically at around 12 p.m. Secondly, there was supposed to have a peak at 4 p.m. Sunday in coaster alley, but the fact is that there was no any peak in that time. So, we can confirm the time of the vandalism is around 12 p.m. in Sunday.
I selected time from 11 a.m to 1 p.m. Sunday data and excluded the data which showed messages sent to external and ID 839736, because as the above analytics said the number of messages sent from ID 839736 is very large and those messages were sent in coaster alley which may make mislead the result.
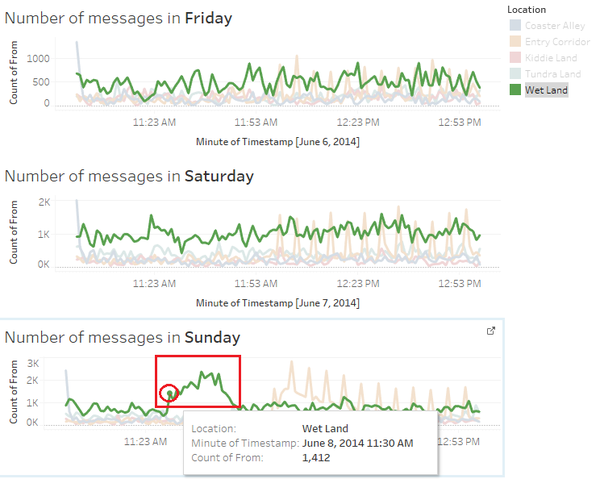
As the figure shown, we can find that the pattern in other locations were all similar except Wet Land. Next, focused on the 11a.m. to 1p.m. in wet land. We can see that the peak started at 11:30 a.m. I assumed that because at 11:30 a.m., many visitors found that vandalism so that the information about the vandalism spread all over the park which leads to the sudden large number of messages at 11:30 a.m.
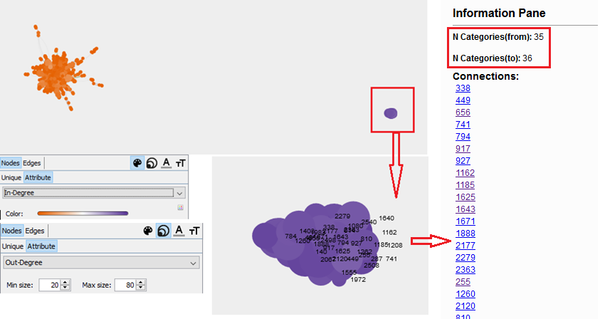
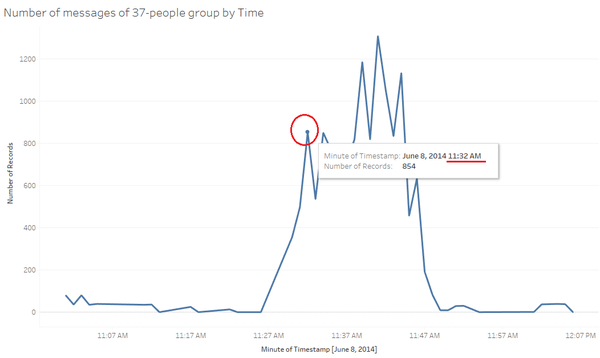
And from the first following graph, I noticed a unique group which had highly degree of connection within group but didn’t communicate with other visitors. I observed this group and found that this is a 37-people group. This group could be the first witness of the vandalism.
Finally, I use those group's data to built a chart about the number of messages within this group by time. I noticed that the peak was started at 11:32a.m. So, It can be concluded that time of vandalism was discovered was 11:32 a.m. Sunday.

