IS428 2016-17 Term1 Assign3 Lim Kim Yong
Contents
Background
After the successful resolution of the 2014 kidnapping at GAStech’s Abila, Kronos office, GAStech officials determined that Abila offices needed a significant upgrade. At the end of 2015, the growing company moved into a new, state-of-the-art three-story building near their previous location. With their move into the new building, GAStech has introduced a new initiative to tighten their security procedures.
GASTech has installed proximity detectors throughout the building to enhance the safety and security of its employees. Staff members are given and encouraged to put on proximity (prox) cards while in the building. There are two types of proximity sensors, fixed sensors that register when a badge crosses a boundary and a mobile sensor reader, nicknamed Rosie, which identifies and records any prox cards in the vicinity she travels in.
Besides, the new office is built to the highest energy efficiency standard, but as with any new building, there are still several HVAC issues to work out. The building is divided into several HVAC (heating, ventilation, and air conditioning) zones. Each zone is instrumented with sensors that report building temperatures, heating and cooling system status values, and concentration levels of various chemicals such as carbon dioxide (abbreviated CO2) and hazium(abbreviated Haz), a recently discovered and possibly dangerous chemical.
Objectives
With the massive amount of data being collected by the various sensors, there's definitely no way any GAStech employee can deal with the data to discover relationships or patterns without using any visualization tools. Hence, using all the visualization and analytical technique that I have learned in class, I aim to create an interactive data visualization to help GAStech management to be able to see patterns/identify anomalies/connections to better understand its operations in order to make better and informed decision.
With this interactive visualization, departments such as Security will be able to keep track of employee movements within the building to ensure that they are safe and also to prevent any unauthorized access to areas/zones that are prohibited. Furthermore, facility managers and executives could possibly identify areas that can improve the office environment such as to save costs and also to provide a conducive working environment for all GAStech employees.
Information Gathering
Looking at the given description of this challenge, there are some key information mentioned that are helpful and critical for my investigation.
- Staff members are required to wear proximity (prox) cards while in the building.
- The building is instrumented with passive prox card readers that cover individual building zones.
- Rosie – a free robotic mail delivery system is equipped with a mobile prox sensor, which identifies the prox cards in the areas she travels through.
Based on the given data, like any visualization processes, it is imperative and critical to understand and look through the data before using any visualization software. I will be using Tableau as my visualization software and there are some work to be done on the given datasets before I plot my visualizations.
Employee List & Fixed/Mobile Proximity Data
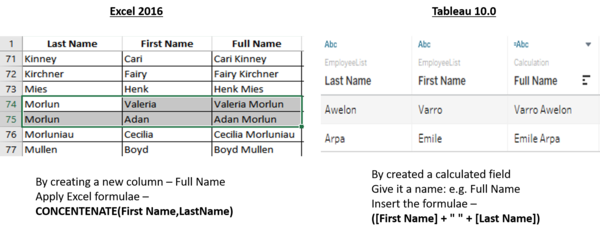
Data doesn’t always come ready for analysis. As many of you have experienced, some data needs a lot of work before it can be sensibly analyzed. To begin with, Employee List provided names in the format of Last Name and First Name. Therefore, the first thing I did to better identify these people, I used the Excel CONCATENATE () function to join all of them into a unique single column called Full Name (First Name – Last Name) format. This is because among the employees there are people with similar first or last names.
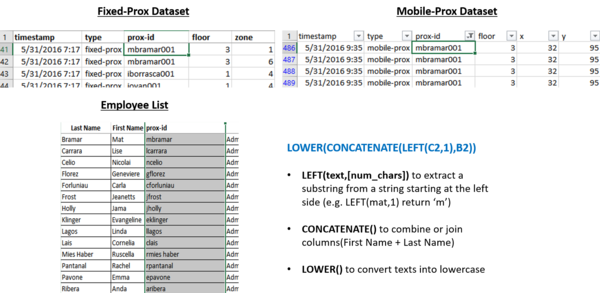
Moving forward, I went on to find out how does a typical day look like for a GAStech employees. With the above information provided by the Employee list, it is only possible for me to make assumption that all employees are staying in their respective office throughout the whole day which is highly unlikely the case. As such, I went ahead to investigate further on other available datasets hoping to spot any patterns or relationships. Given the information from the case, we know that all employees are required to wear a proximity card while they are in the building, and proximity detectors have been installed throughout the building to enhance the safety and security of its employees. There are two types of proximity sensors, fixed sensors that register when a proxy card crosses a boundary and a mobile sensor reader that moves throughout the building to detect and record any available proxy cards within its vicinity. Both proxOut-MC2.csv and proxMobileOut.csv contains a field name: prox-id that could possibly help us to identify the whereabouts of an individual employee together with their given timestamp. Hence, I have created a new column name: prox-id in the Employee list using Excel formula as shown below:
With that, we are able to map the prox-id in the Employee List with the proxOut and proxMobileOut lists. Although I have managed to create the prox-id column, I still need to manually locate and make changes to those inconsistent prox-ids that are either wrong in spelling or contains extra characters (e.g.”- “, or <space>,”.”). This is to avoid inaccuracy of information being retrieved when analysing data.
After the first batch of data cleaning, I move on to investigate what are the typical patterns that I could find based on the given proximity card data. The proximity card data comprises of two separate .csv files – proxOut-MC2.csv (contains the Fixed-prox data) and proxMobileOut.csv (contains the Mobile prox data). Given the x, y coordinates in the mobile prox dataset, we can easily plot it onto tableau and add the different background images on to it for better visualization and clarity. Additionally, we also find out that the mobile robot, Rosie operates in two different shifts, hence the data collected by Rosie is from Morning: 0900H – 1000H and Afternoon: 1400H – 1500H respectively.
After that, I move on to plot the visualizations for the fixed-proximity dataset. However, we are not given the x, y coordinates this time, so I spent quite a long time trying to figure out how to create those coordinates. Eventually, I would like to give credit to one of my fellow classmate, Gwendoline Tan, as I’ve gotten valuable insights on how to create them. Refer to the steps on her page.
|
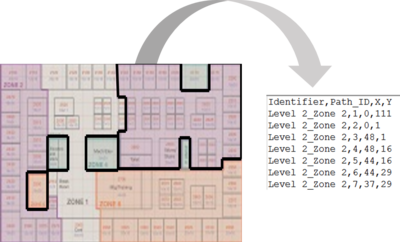
First of all, the (x,y) coordinates are based per floor with the lower left of the provided map being (0,0) and the upper right being (189,111). Thus, I have cropped the pictures of ProxZones F1, F2, F3 and resized them into (189,111) use Paint Tool. I then proceed to use the tool provided from this Website:https://tableauandbehold.com/2015/04/13/creating-custom-polygons-on-a-background-image/ so as to create custom polygons based on the background image and retrieve the vertices of each polygon that I’ve drawn. The data is shown in figure 3 – with field names (Identifier, Path_ID, X, Y). In my case, I am drawing the outlines for the various zones of each floor. | |
|
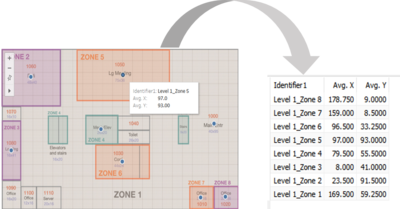
After which, I imported the data into tableau to retrieve the center point of the x, y coordinates by floors and zones respectively.However, there are some datapoints that are out of the zones, so to resolve this error, I had to perform a manual task. As such, I make use of Tableau function - "Annotate" which allows me to select a specific mark and retrieve the x,y coordinates. This process is repeated until all the centre point has been fixed. Finally, I have successfully created the x,y coordinates for the fixed-prox dataset. | |
|
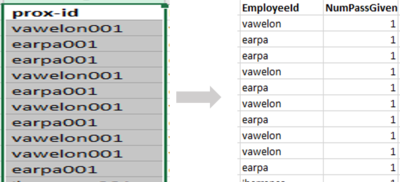
For both the fixed-prox and mobile-prox datasets, I split up the prox-id column and created 2 new columns: EmployeeId and NumPassGiven by using Excel Formula.
Extract all characters starting on the left side until it reaches the character “0” and -1 to remove the “0”.
|
The interactive visualization can be accessed here:https://public.tableau.com/profile/lim.kim.yong#!/vizhome/VA_Assignment3_Final6/Home_Page
The resolution of the visualization is custom set at the size of 1280 x 700 for a better user experience.Throughout all the different dashboards, useful tips/sharings will be provided to assists users in navigating through the different filters and actions so that their analysis can be performed smoothly.
Home Dashboard
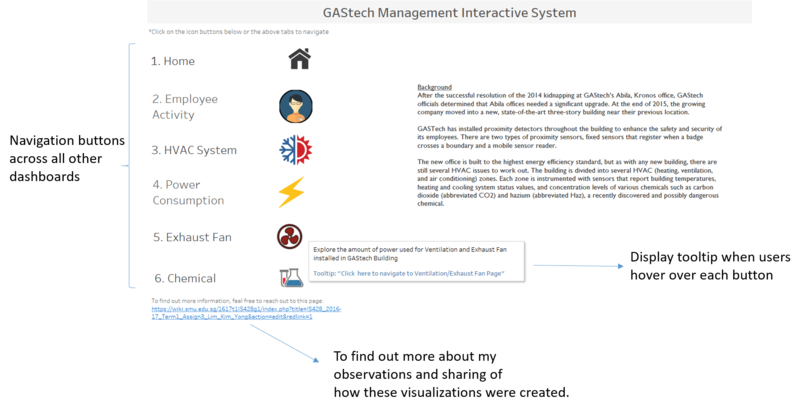
A homepage is created with 6 different data categories in mind - Home, Employee Activity, HVAC System, Power Consumption, Exhaust Fan and Chemical. Each of these categories are further broken down into its respective sub-categories for the ease of users to perform their analysis. As such, users can select any categories that they are interested in to conduct their investigations.
The following shows the home dashboard:
Employee Activity
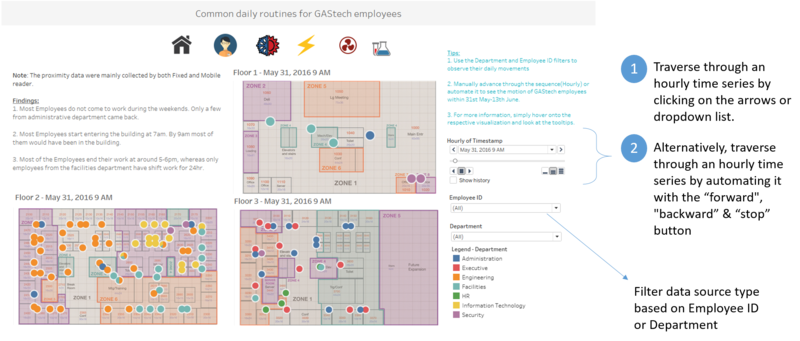
The following shows the employee movement dashboard:
Based on the given dataset, GAStech has 7 departments: Administration, Engineering, Executive, Facilities, HR, Information Technology, and lastly Security. I have decided to use tableau to visualize how does a typical day look like for GAStech employees by the various departments.
To assist with my exploration, I decided to use “Sort”, “Filter” and “Pages” to show the movements of employees from all the different departments throughout a typical day. Below are some of the screenshots that I got after using “Filter”, “Sort” and “Pages” functions.
The “Pages” shelf creates a set of pages, with a different view on each page. For e.g. the view below shows the movements of all employees from various departments and floor for each hour throughout the entire 2 weeks (31st of May to 13th of June).
Q1)Typical Patterns In Proximity Card Data & Typical Day Of GAStech Employees
The following shows the typical routine for GAStech employees in a specific department in general:
| Department | Activities |
|---|---|
| |
| |
| |
| |
| |
| |
|
Based on the information gathered above, the typical day for GAStech employees, in all departments:
- Employees start entering into the building at 7am. By 9am, majority of the employees would have already reached their compartment/office.
- Lunch break is usually in between 12pm to 2pm.
- By 2pm, most of the employees will be back as observed by the large amount of movements/activities occurring during that period in all level of floors.
- Employees typically ends work at around 5-6pm.
- After 6pm, most of the departments would have left except employees from the Facilities,Engineering and IT department.
- After 7pm, employees working in level 3, mainly executives, would have left the office.
- At 12am, most of the employees would have left the building except for Facilities department who are on 24-hour rotational shift.
- It is always the same people in facilities department that perform the night shift(Employee Stenig and Varja are found in Floor 1 as their offices are located in that floor).
- Most GAStech employees do not work during the weekends. However, a few of the employees from the administration department came back during the weekends and work from 8am onwards till latest 3pm.
- Some Employees from the Engineering & IT departments often stay till 11pm-12am.
Reference
- Gephi GUI Description- This is REALLY helpful
Below are some works I personally admire and learning from it. Not listed with specific ranking.
