IS428 2016-17 Term1 Assign3 Heng Yi Teng Mabel
Contents
Visualization
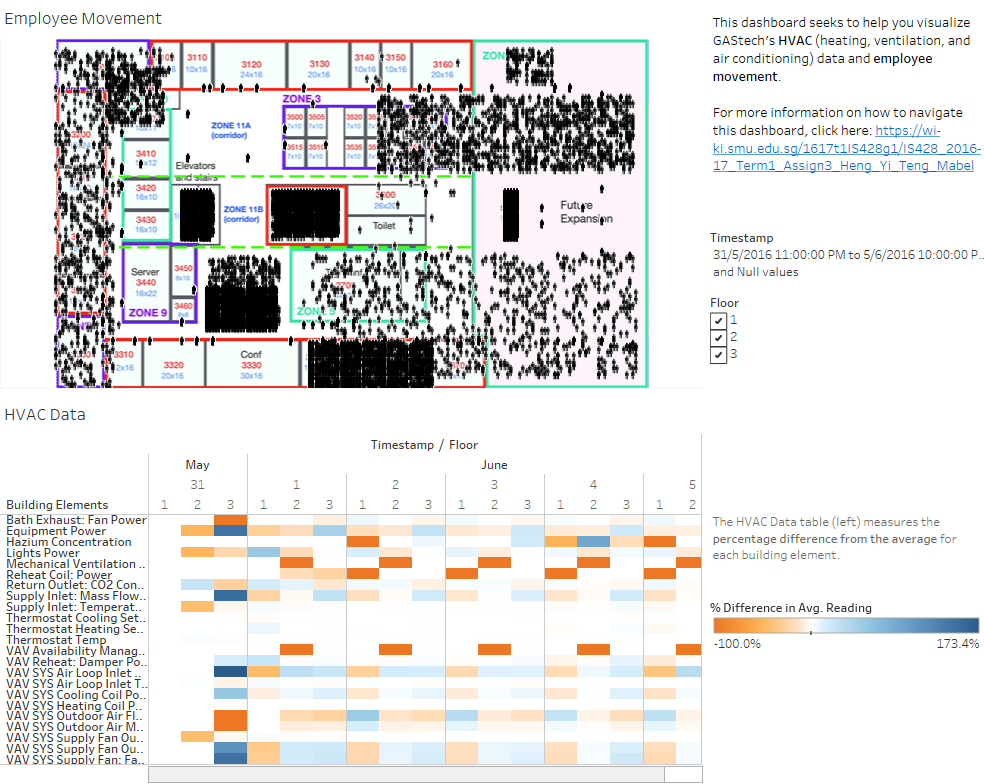
Click on the image below to explore the interactive dashboard or click here to view the entire Tableau workbook.
Data Cleaning
Building Data
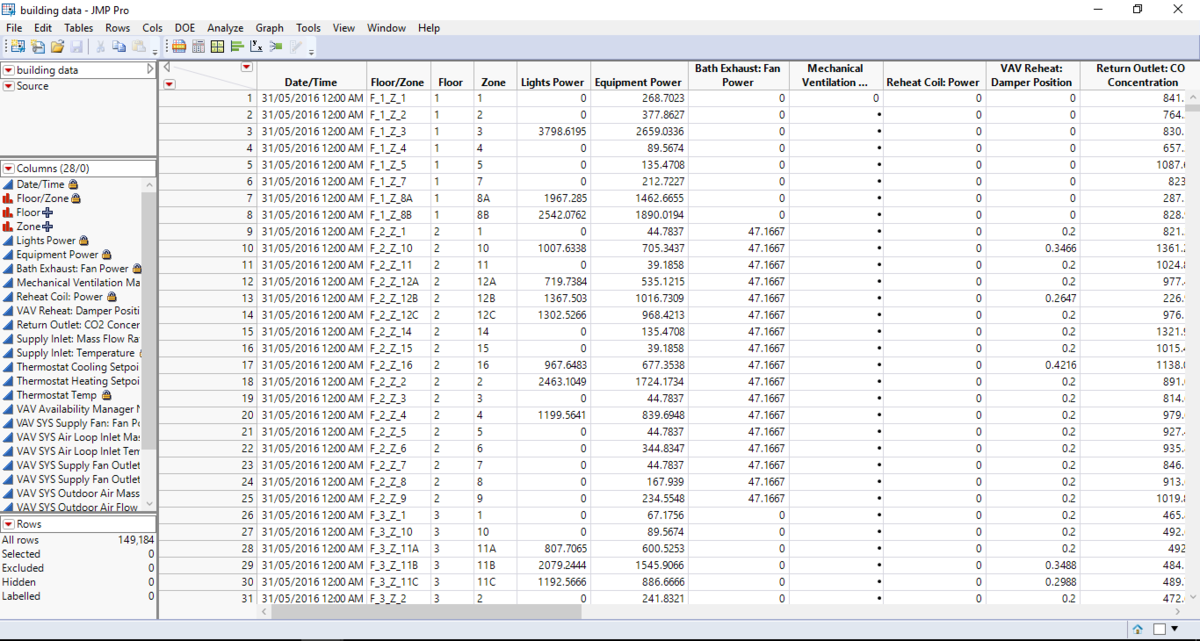
I wanted to create a variable Floor/Zone so I used the Stack function in JMP.
Result:
Next, I used the Text to Columns function to create 3 new variables: Floor/Zone, Floor and Zone.
I did this transformation on all the building data, including the Hazium sensor data, and got the combined data file below.
Finally, I used Stack to combine all the Building Elements into one variable. A sample from the final data file is as shown below.
Sensor Data
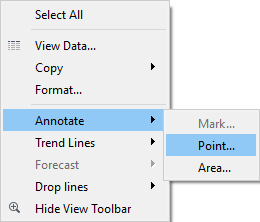
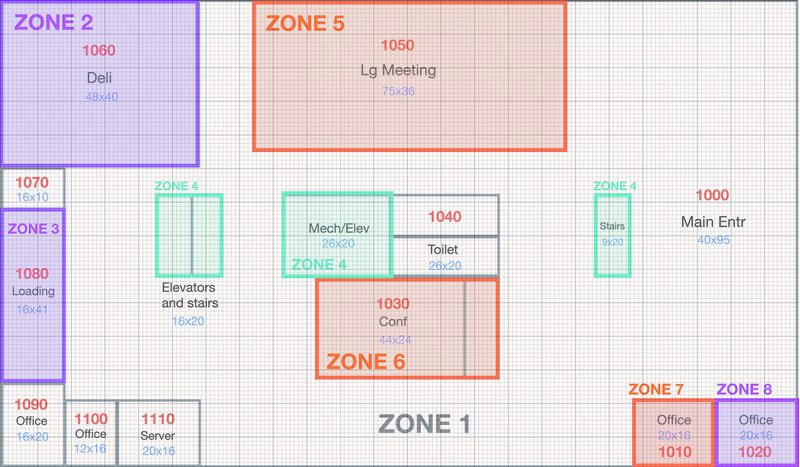
I needed (x,y) coordinates for mapping on Tableau. The fixed sensor data, proxOut-MC2.csv, did not have coordinates. To assign them with coordinates, I uploaded the ProxZones floor plans onto Tableau (see section on Creating a Map for Sensor Data for more detail) and used the Annotate Point function to retrieve approximate coordinates for each zone.
For each zone I took 2 (x,y) coordinates. Next, I matched the coordinates to the fixed sensor data based on the variables Floor and Zone.
I then randomly assigned each record to a coordinate within the respective zones.
Next I used JMP to Join the fixed sensor and mobile sensor datasets based on timestamp, proxid and floor. I did this because I wanted to check if there were instances in which both the fixed and mobile sensors recorded the same activity.
In these cases, I chose to keep the mobile sensor data as it already comes with (x,y) coordinates. I then deleted the repeat fixed sensor data. Lastly, I combined all the sensor data into 1 dataset.
Visualization Process
Building Data
TBC
Creating a Map for Sensor Data
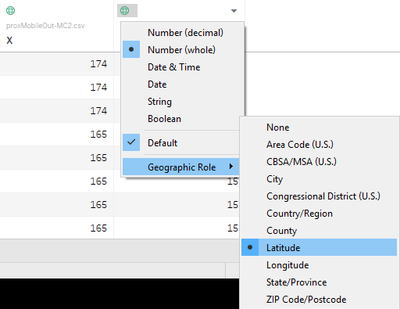
I first loaded the mobile sensor data, proxMobileOut-MC2.csv, into Tableau. On the Data Source tab, I changed the Geographic Roles for X and Y to Longitude and Latitude respectively.
Next, in a new worksheet, I dragged X to Columns and Y to Rows. However, we can see below that the data points are superimposed onto a default world map.
Instead, we want to upload a map of the floor plans for the building. First, I manually cropped the VAST_ProxZones_Fx.jpg files and removed the white spaces, leaving only the floor plan. The result is something like this:
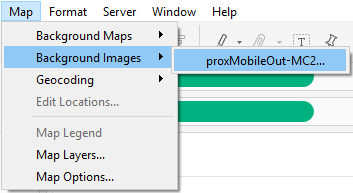
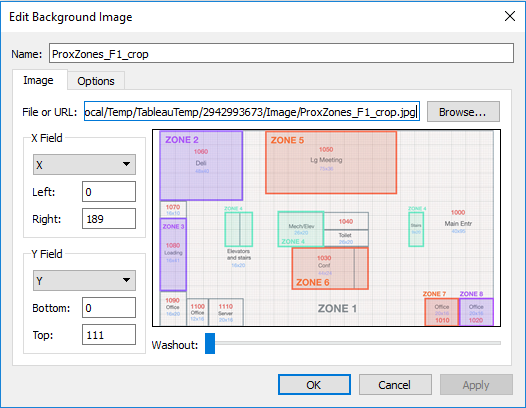
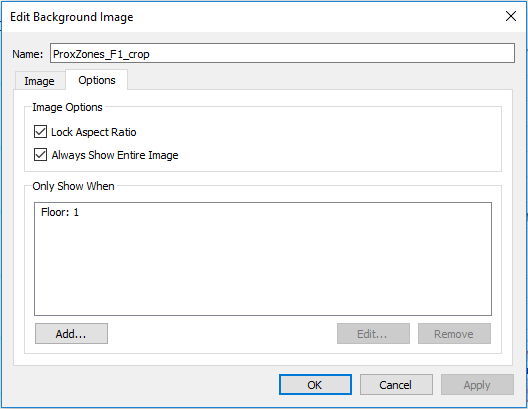
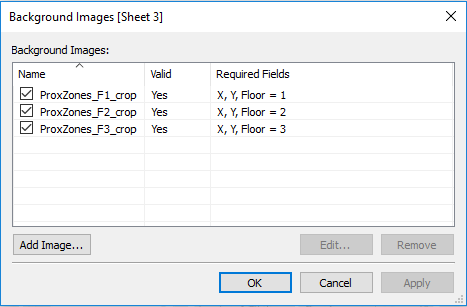
Next on Tableau, I uploaded the images under Map. As there are 3 floors, I had to upload 3 different floor plan images and set different conditions for them.
Lastly, I used the variable Floor as a filter to toggle between views of the map. This yielded the following:
