IS428 2016-17 Term1 Assign2 Margot Marie T Stelleman
Contents
Abstract
People can have the feeling to feel safe everywhere but still, there is always a risk to get injured. This project concentrates on injuries in workplace in Singapore. Thanks to Interactive Data Exploration and Analysis of data of Workplace and Health Institute of Singapore, it allows us to answer easily to several questions about this topic. Which type of industries is more affected by injuries? Will more injuries happen in larger companies? At what time of the year or of the day, for example, is it more common to get injured? What sex is injured the most?
Data Visualisation System Design Process
Step 1: Identify a theme of interest
Each of the dataset provides a wide range of parameters that can be used for many different purposes. Hence, it is very important for you to identify a theme clearly before you start your investigation. For example, you might want to focus on issues related to business competitiveness.
Step 2: Define questions for investigation
After you have identified a theme, you should now formulate questions for investigation. For example: Is there a relationship between sales revenue and marketing expenditure? Are the growth of GPD per capita and the growth of productivity correlated? Are there different patterns of energy consumption in different regions of the world?
- Which sector is the most affected by injuries? And how the size of a company affects this number? - What is the proportion of males/females having injuries? We can ask ourselves how this proportion is by age categories, overtime hours, sectors or still in duties hour. - Are some time’s moments more particularly affected by injuries? (month, weekday, day time) - Are the injuries reported immediately? I was cleaning the data file and I realized this question could not be answered precisely because information available was not precise. The accident date was available but the reported accident month was only available, which make non-sense and no utility when we want a precise answer to this question. - Which body part will be more injured regarding the different sector - Does a injury linked with a lack of experience?
Step 3: Find appropriate data attributes
I have first cleaned the file. This step is very important. Why? Because some columns in the Excel file need to be deleted because they are not relevant to the study and the questions we want to answer. I have deleted the following ones: - Reported date since this date was not giving any information about the day and that there is a column specifying the month when the injury has been reported called “Reported Month”. - Accident date has been deleted because it was presenting the same problem as Reported date by not specifying the day, Accident day presents the entire and complete date but has been also deleted since we have any complete for the reported one we are keeping only the month for Accident happening. - Since we are keeping the written month and making it as categorical data, Accident month in date form, adding no information, has been deleted. - Accident Year is only 2014, this column is not giving any additional information and is deleted. We just need to specify that the data we are dealing with are from 2014. - Org SSIC (2010) is given a indication of the activity of the company but since we have the “Sub Industry (SSIC 2010)” column giving us an insight of it , this Org SSIC (2010), 3-digit SSIC (2010), 2-digit SSIC (2010), Major Industry (SSIC 2010) columns are not necessary because they are not giving clear and not enough precise information to read for the purpose of the research. - Accident Type Level 2 Desc, Accident Type level 2 Category, Cause, Accident Type Level 2, Accident Agency Level 1 Desc, Accident Agency Level 1, Accident Agency Level 2 Desc, Accident Agency Level 2, all these columns have been deleted. Because of the choice to keep an aggregate level of this information with the “Major Injury Indicator” column. - Victim's Employment Start Mth and Victim Employment Start (MMM) give similar information than “Victim's Employment Start Date” so they have been deleted. - Employer's SSIC is not necessary because occupation has already a column dedicated. - Pct Manual Work is just dividing in two categories, not enough precise and will be deleted. - Accident Weekday No has also been deleted because repeating with ”Accident Weekday”. - Reported Month has been deleted since it could not give an accurate and representative answer to the fact we wanted to know if the reports were reported immediately since we do not have the precise date and then the number of days between accident happened and actually reported. - Informant Type is not relevant for our questions and has been deleted. - Victim's Employment Start Date and Victim Employment Start (MMM) have been deleted since we are considering experience only with column “Months Worked”. - Hospital / Clinic Treated or Examined deleted because not giving essential information to our questions.
And then, some transformations to have the good and useful attributes were necessary. Here are all the modifications I have done:
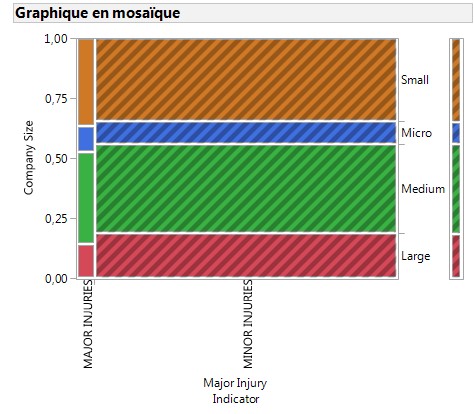
- Number of Employees has been separated in categories to let appear the size of the companies since we are wondering in which size of enterprises are the most affected by injuries. It has been splitted following this pattern: • micro enterprises: fewer than 10 persons employed; • small enterprises: 10 to 49 persons employed; • medium-sized enterprises: 50 to 249 persons employed; • large enterprises: 250 or more persons employed.
And used this formula to do it: =IF(E2<10;"Micro";IF(AND(E2>=10;E2<50);"Small";IF(AND(E2>=50;E2<250);"Medium";"Large"))). Giving birth to new column Company Size which I copy and paste to have no link anymore with the numbers of employees and delete this column.
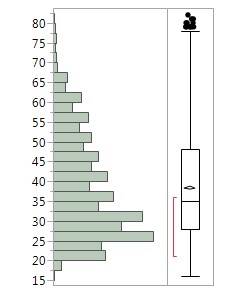
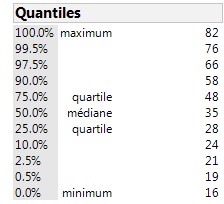
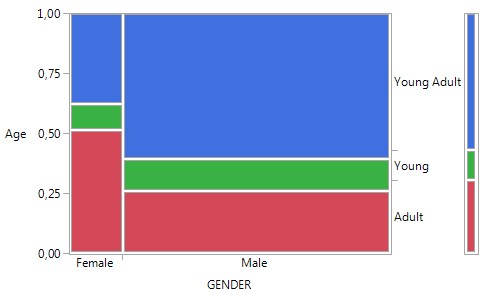
- Accident time has been modified to be separate in categories. Morning if the time was between 6am and 12am, Afternoon between 12am and 18pm and Night for the rest. The idea is to know what part of the day was most affected by injuries. The following formula on Excel has been used: =IF(AND(H2>$I$2;H2<$I$3);"Morning";(IF(AND(H2>$I$3;H2<$I$4);"Afternoon";"Night"))). Then the column of the results has been paste and next deleted, also Accident Time with the hours to have only a column Accident Time but in these categories. - Victim’s Gender has been transformed into GENDER column to get a more esthetic form by having F=Female and using an IF formula. - Then I have splitted Age under category following this: Under 24 for Young, 25-44 for Young Adult, Above 45 for Adult. When we look at the distribution in JMP, these categories look “homogenous” even if the Young Adult one will have more people in it. A bit less of 25 percent is in the Young Category and a bit more than 25 percent are above 45 years old. As we can see in the boxplot graph under, this last category is way more dispersed.
Visualization Software used and evaluation
Approach
Results
References
http://ec.europa.eu/eurostat/statistics-explained/index.php/Glossary:Enterprise_size
