IS428 2016-17 Term1 Assign1 Heng Yi Teng Mabel
Industrial Properties
Industrial Properties Data Cleaning
From REALIS, private and public property data were extracted separately and csv files were combined using cmd in Windows.
Since there was no field for selecting a timeframe in REALIS, I used “Written Permission Date” as a proxy for when the property was supplied. “Written Permission Date” was reformatted in Excel to ensure it was in Tableau-readable date format. Irrelevant records were deleted where the “Written Permission Date” field was empty or year was 2016. Upon data import into Tableau, it appeared there were no records of commercial public property supply before 2014, making records before 2014 meaningless for calculating share of private property supply. Hence all years were filtered out except for 2014 and 2015.
I also noticed there were columns pertaining to factory space and warehouse space in the dataset, indicating there two categories under industrial properties. Hence I used Excel to recode these columns into a new column "Category" where records were classified into factory or warehouse.
Graphical Design
As the data is categorical, I chose to use bar charts. The simplicity allows the reader to quickly draw conclusions. Where a larger number of categories are used in the analysis, I chose to use a deviation analysis rather than a side-by-side bar chart. This simplifies the image and allow the reader to spot trends at a quick glance.
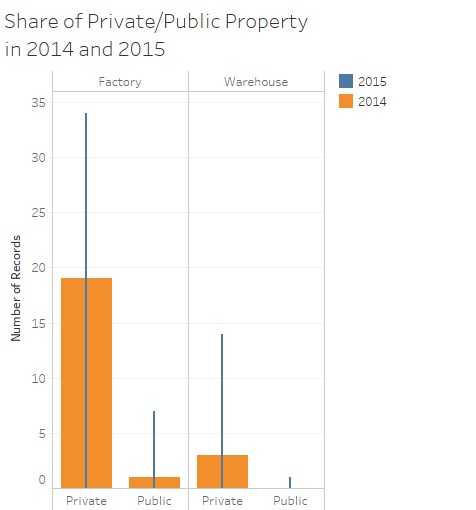
In 2014 and 2015, the supply in number of private industrial properties far exceeded that of public industrial properties. 2015 also saw an increase in number of both private and public industrial properties as compared to 2014.
Across public and private factories and warehouses, all categories experienced growth in supply.
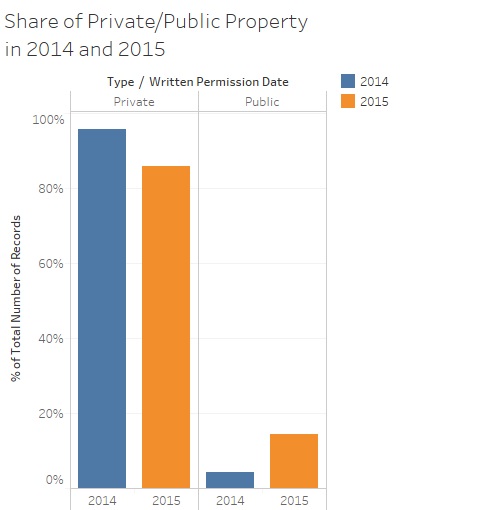
However, further analysis shows that the share of private industrial properties actually decreased in 2015. Compared to 2014, 2015 had a reduced share of private properties and an increased share of public properties.
Commercial Properties
Data Cleaning
Similar to the data cleaning for the Industrial Properties, “Written Permission Date” was used as a proxy for date supplied and reformatted. Irrelevant data were deleted, leaving entries from 2014 to 2015.
When extracting from REALIS, commercial properties data produced columns pertaining to office space, retail space and hotel rooms. Hence I deduced that commercial properties were categorised into office, retail and hotel spaces and created a new column “Usage”. If a project had values in the hotel room-related columns, I would recode it as “Hotel”. If a project had values in more than one column e.g. in the office and retail space columns, I would duplicate the row and record one as “Office” and the other as “Retail”.
Graphical Design
Bar charts were chosen as the data is categorical. I also chose a deviation analysis, rather than a side-by-side bar chart due to the larger number of columns. Overlaying columns allow the reader to spot trends at a glance.
biii. Analysis
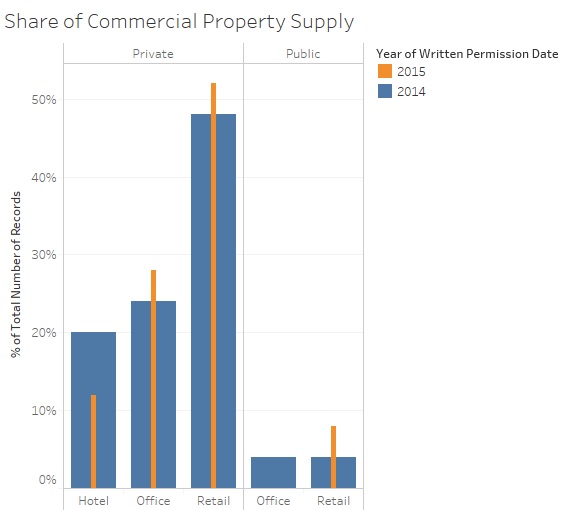
At a glance, we cannot spot any trend in commercial property supply. The difference in numbers from 2014 to 2015 appear small.
However, a deviation analysis allows us to quickly observe that private property dominates the supply of commercial property. The share of office and retail space has increased in 2015. This is probably fueled by a decrease in share of commercial hotel spaces.


