IS428 2016-17 Term1 Assign1 Ong Ming Hao
Contents
Infograph
Abstract
Problem & Motivation
A recent study done by the Economist Intelligence Unit (EIU) in 2016 found out that Singapore is the most expensive city in the world. [1] This report is done by comparing the cost of living in New York City with Cities around the world. From housing, food, education, etc. In addition, according to the Singapore Real Estate Exchange, it found out that the median price for an executive apartment in Singapore is $626,000. [2] At this price, many Singaporeans would find it hard to buy a house and start their own families. Singaporeans should not have to take up exorbitant loans for basic housing. As such, the focus of this article is to examine and analyse the following: 1. Singapore Property Market 2. Current Government Plans 3. Current Government Policies By doing so, we are able to determine whether the government is doing is effective job in bringing the price of the Singapore’s Housing Market, and what more can be done to reduce the price of the average Singapore property.
Targeted Data & Policies
Rationale for choosing Data
I have chosen a few data sets from REALIS. The first data set is a list of private property transactions done in 2015. This would help me identify any trends in the private property market, in terms of location, type of housing or pricing per square foot. The next set of data that I want to analyse is vacancy and vacancy rate of private property and the amount of private property projects in progress. This would help me identify places of interest where the government should reduce building in, or change the type of building (commercial, businesses,parks,residential,etc.)
Initial Data Cleaning
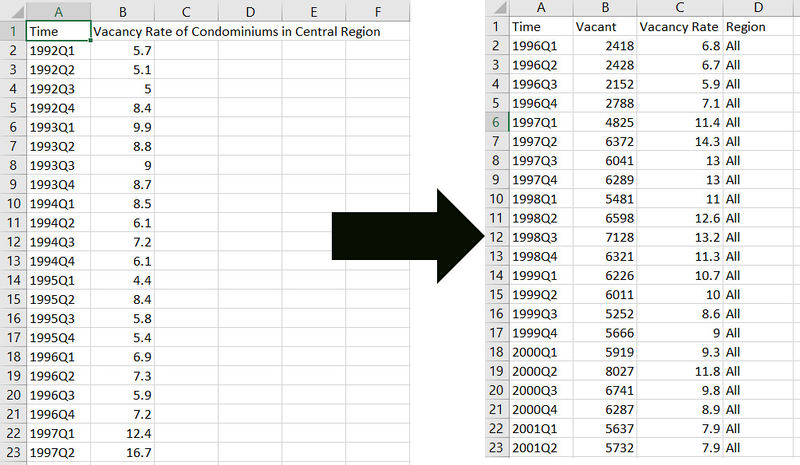
Some data that I retrieved from REALIS was needed to be appended together. Such as determining the vacancy rate and vacancy of Condominiums. As such, I had to do some data cleaning to ensure that Tableau was able to read the information.
