IS428 2016-17 Term1 Assign3 Ong Ming Hao
Contents
Understanding the problem
Introduction
Before I embark on this analysis. I’ve decided on properly understand the problem and plan on how I intend to visualise these data. I came a few steps in which I am able to better understand the problem. These are the steps:
- Understanding the problem
- Select appropriate Data Sources
- Select the appropriate visualisation tool
- Layout of the visualisation
By doing so, I was able gather better insights and visualisations since I am able to identify the root cause of the problem. The goal of this analysis is for me to learn various visual analytics tools to evaluate the effectiveness of such tools. In addition, I would also like to try out various data cleaning software in order to also evaluate their effectiveness.
Tools Used
For this assignment, I plan to use the following tools to analyse, identify patterns and gather insights from GAStech’s Abila. I’ve split it up into 2 main categories – Visual Analytics Tools and Data Cleaning Software. Visual Analytics Tool
- Tablueau 10.0.0
- Power BI
Data Cleaning Software
- Microsoft Excel
- JMP
- OpenRefine (Formally known as Google Refine)
Understanding Question 1
What are the typical patterns in the prox card data? What does a typical day look like for GAStech employees? To answer this question, we must look at the data which was provided to us. I’ve found out that we must use the following files so that we are able to gather an in-depth understanding of the data.
- Vast Prov Zone F1, F2, F3 – To understand where the various zones are.
- Employees List – To understand the GAStech employees, their job roles, etc.
- Data Format – To understand the data even greater detail
- ProxOut-MC2.csv – Raw Data of movement by X and Y Coordinates
- ProxMobileOut-MC2.csv – Raw Data of movement by zones
Upon initial inspection of the data, I realised some things. Firstly, in “proxOut-MC2.csv” and “proxMobileOut-MC2.csv”, we had to link the prox-id to the employee in the “Employee List.xlsx”. Next, we had to take note of the various employees with last names. Lastly, each prox-id has numbers trailing at the end. After much considerations and investigation, I assumed that these numbers can be removed without any implications. Which resulted in the following.
Understanding Question 2
Describe up to ten of the most interesting patterns that appear in the building data. Describe what is notable about the pattern and explain its possible significance. To answer these question, we must use the following files so that we are able to gather an in-depth understanding of the data.
- bldg-MC2.csv – The breakdown of the building datasets for temperature, energy consumption, etc.
- f1z8a-MC2.csv – The data of the Hazium Concentration for Floor 1 Zone 8A.
- f2z2-MC2.csv – The data of the Hazium Concentration for Floor 2 Zone 2.
- f2z4-MC2.csv – The data of the Hazium Concentration for Floor 2 Zone 4
- f3z1-MC2.csv – The data of the Hazium Concentration for Floor 3 Zone 1.
The data retrieved from “bldg-MC2.csv” is massive and it is hard to make much sense out of it. As such, we should break these csv file into 2, where it is more appropriate for analysis. The first csv file (Floor-Zones-Data.csv) would breakdown all the different values for the different floors and zones. The second csv file would give a general breakdown of everything not related to zones. (No-Floor-Zones-Data.csv)
Effectiveness of the various Data Cleaning Software
Cleaning the first set of data
Microsoft Excel
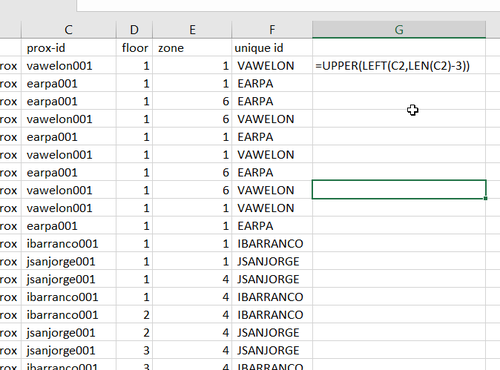
In order to clean both “proxOut-MC2.csv” and “proxMobileOut-MC2.csv”, it would be very simple with Microsoft Excel. I used the function “=UPPER(LEFT(C2,LEN(C2)-3))” in order to retrieve the final output.
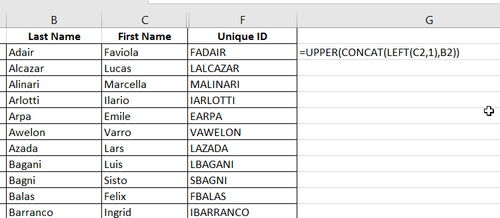
However, the real issue comes when trying to clean employees list. I realised that some employees name would be inconsistent with the final output at the end due to the differences in their name. Although 95% of the employees has the right format (the first letter of their First Name followed by their whole last names). We had a few exceptions to this rule. This exceptions include
- Their last name include their spouse name (example: “Willem Vasco-Pais”)
- Their name had is made up of 2 words (example: “Sten Sanjorge Jr.”)
- Their the prox-id that was given to them had a typo (example: “Faraldo Raphale’s ID is RFARALSO”)
After I used the function, “=UPPER(CONCAT(LEFT(C2,1),B2))”, to extract the unique IDs for everyone, I had to manually track them the abnormalizes and manually change it.
OpenRefine
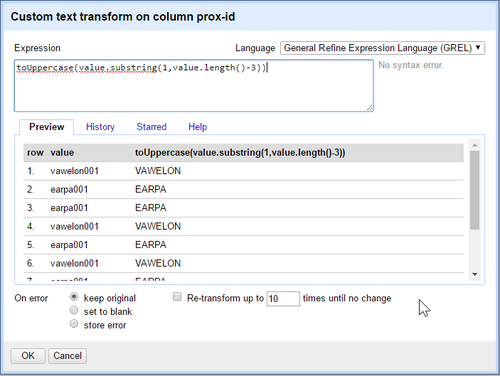
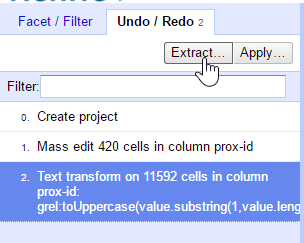
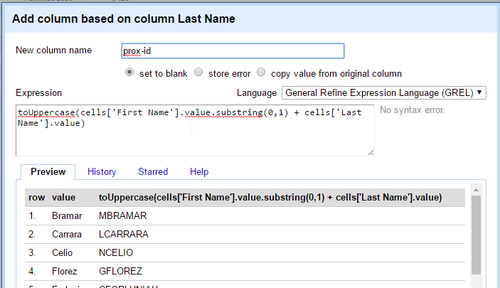
Similar to Microsoft Excel, it cleaned both “proxOut-MC2.csv” and “proxMobileOut-MC2.csv” at a surprising faster rate. After I used the specific function to retrieve the Unique ID, I could just extract all the changes that I did in the OpenRefine project and apply it directly to the other file.
While cleaning the employees list, I also had the same issue that I faced with some employee’s name being inconsistent with the final output. The difference between this and Microsoft Excel was that I was able to quickly find for inconsistencies using the “Text Facet” Function, allowing me for quick editing of wrong Unique IDs.
JMP
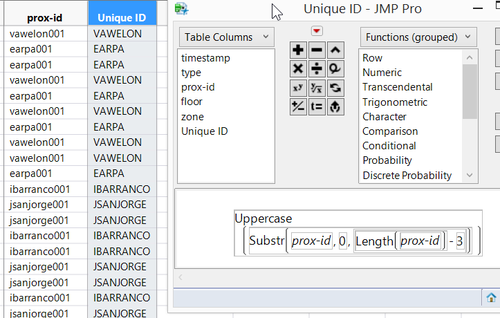
Similar to both OpenRefine and Microsoft Excel, it cleaned both “proxOut-MC2.csv” and “proxMobileOut-MC2.csv” with the same formula “Uppercase(SubStr(prox-id,0,Length(prox-id) – 3)))” However, for JMP’s case I could tell that it was slower to change the text due to the size of the data.
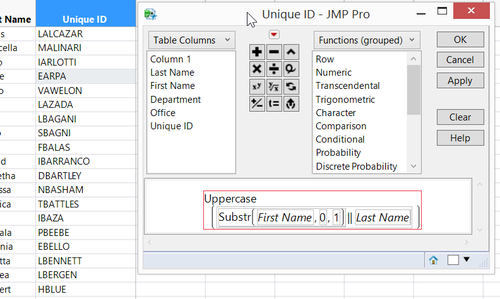
To clean the employees list, it is generally the same as OpenRefine. After implementing the formula “Uppercase(Substr(First Name,0,1)||LastName)”, I had to manually edit all the Unique IDs that had problems.
Cleaning the first set of data
Microsoft Excel & OpenRefine
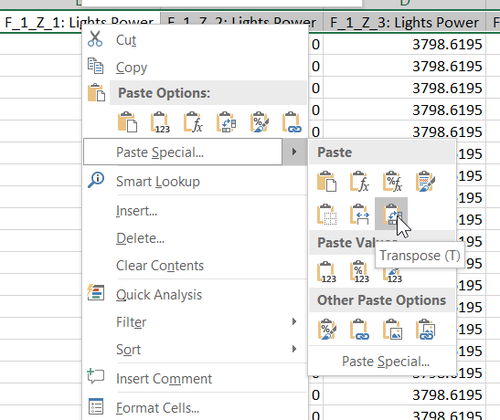
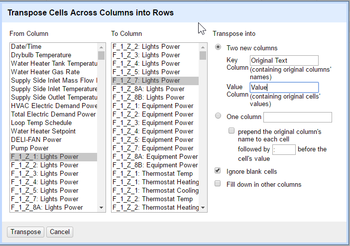
In order to achieve the separation of data into 2 excel files, we needed to transpose the columns into rows. Showing the information of each Floor-Zones as well as all the information that was found. Although both of them have the ability to transpose columns into rows. The amount of effort required to complete this task is too much, and it would be better off finding a much better solution instead.
JMP
Luckily, I have found a way to transpose the data efficiently by using JMP.
Summary and Findings
After using Microsoft Excel, OpenRefine and JMP, these are my conclusions.
For quick and simple data cleaning and transformation, we should OpenRefine to change a lot of text at the same time. It’s quick transformative power would make it a great tool since it is able to quickly transform large amount of data. Although it can transpose columns into rows, its great weakness comes at not allowing all data to be viewed, limited the rows to a maximum of 50 rows, making it very hard to check the validity of the data.
For more complicated functions, we should use JMP to transform data, it can conduct complex functions to transpose columns into rows and transform large amount of text. Its weakness comes at its requirement for large processing power. For laptops that have weaker processing power, it would occasionally lag and it would cause disruptions while doing data analysis.
Lastly, for Microsoft Excel, although it may not be as powerful as JMP or as efficient as OpenRefine, it is great for checking errors and validating the various values due to other functions that it has, such as the dynamic filtering, sorting, duplicate checking and conditional formatting. Without Microsoft Excel, I would not have spotted the typo errors found in the first set of Data.

