IS428 2016-17 Term1 Assign3 Heng Yi Teng Mabel
Contents
Data Cleaning
Building Data
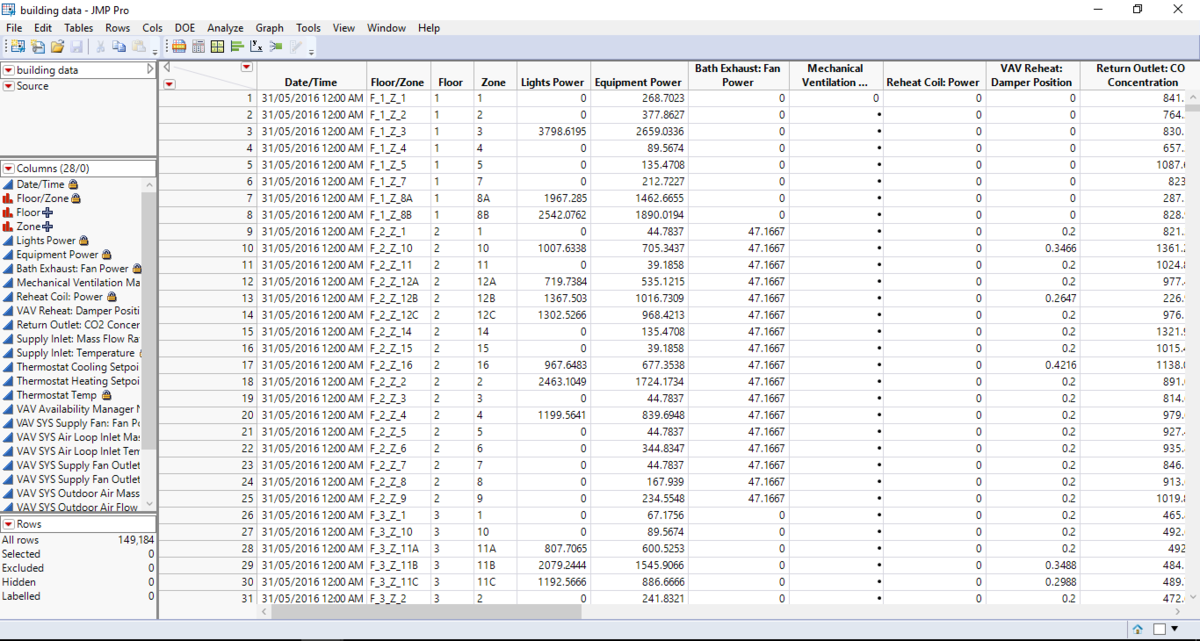
I wanted to create a variable Floor/Zone so I used the Stack function in JMP.
Result:
Next, I used the Text to Columns function to create 3 new variables: Floor/Zone, Floor and Zone.
I did this transformation on all the building data, including the Hazium sensor data, and got the combined data file below.
Finally, I used Stack to combine all the Building Elements into one variable. A sample from the final data file is as shown below.
Sensor Data
TBC
Visualization Process
Building Data
TBC
Creating a Map for Sensor Data
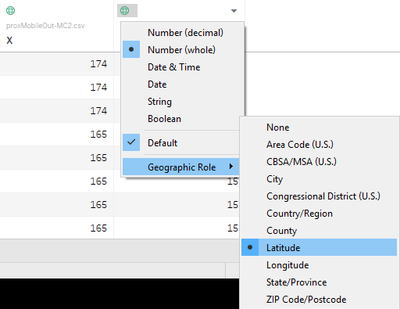
I first loaded the mobile sensor data, proxMobileOut-MC2.csv, into Tableau. On the Data Source tab, I changed the Geographic Roles for X and Y to Longitude and Latitude respectively.
Next, in a new worksheet, I dragged X to Columns and Y to Rows. However, we can see below that the data points are superimposed onto a default world map.
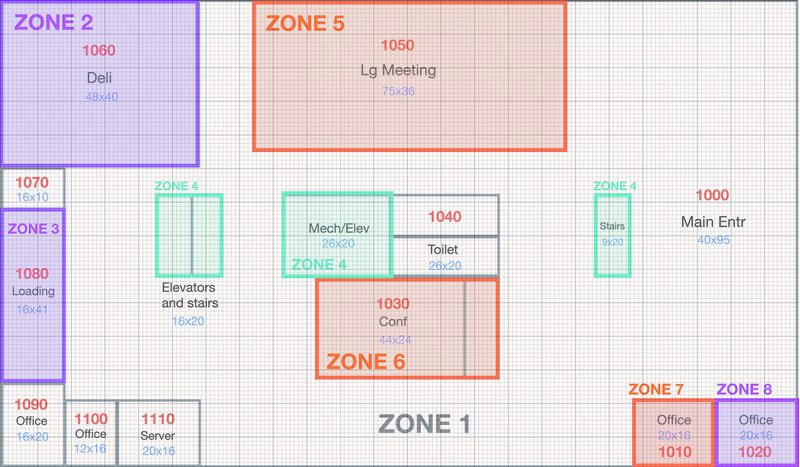
Instead, we want to upload a map of the floor plans for the building. First, I manually cropped the VAST_ProxZones_Fx.jpg files and removed the white spaces, leaving only the floor plan. The result is something like this:
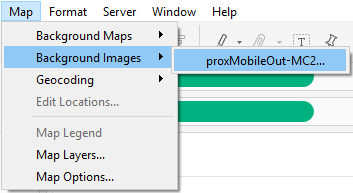
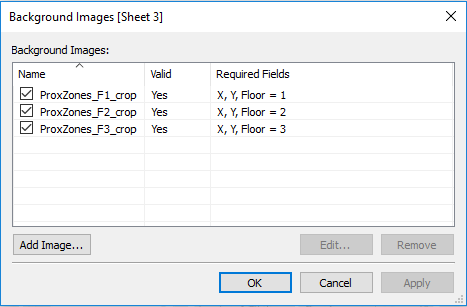
Next on Tableau, I uploaded the images under Map. As there are 3 floors, I had to upload 3 different floor plan images and set different conditions for them.
Lastly, I used the variable Floor as a filter to toggle between views of the map. This yielded the following:
