Difference between revisions of "IS428 2016-17 Term1 Assign2 Wu Wei"
Wei.wu.2014 (talk | contribs) |
Wei.wu.2014 (talk | contribs) |
||
| Line 27: | Line 27: | ||
==Analysis & Visualization Construction Process== | ==Analysis & Visualization Construction Process== | ||
| + | The following content will show how different visual analytics techniques are being applied and how we use these visual tools to analyze the data. | ||
| + | ===Question 2A=== | ||
| + | In order to gain a overview on what kinds of tools/sites researchers are using to search, we would first plot a treemap: | ||
| + | [[File:Treemap001.jpg|1000px]] | ||
| + | |||
==Tools== | ==Tools== | ||
Revision as of 22:46, 25 September 2016
Contents
Theme of Interest
Have you ever heard of the term "Open Access"[1]? If you have never heard about it, I guess you have never tried to get access to those scholarly articles or professional reports online. It is a painful experience when you finally find a research paper relates to your group project on Google Scholar but which requires a purchase to access. Personally, I have such experiences occasionally in many of my school project researches. This is a reason why I am a strong supporter of Open Access Movement[2]. Open Access Movement is the worldwide effort to provide free access to scientific and scholarly researches. In 2013, the US government "issued United States' Federal Agencies with more than $100 million in annual R&D expenditures to develop plans within six months to make the published results of federally funded research freely available to the public within one year of publication" [3]. Other countries like China, Russia, Japan, India and etc, all trying to achieve open access for individuals. Thus, my questions comes out: How is the progress of Open Access Movement? Are we getting fruitful results? Or are we currently in a bottleneck phase indeed?
Find Appropriate Data
Breakdown of questions
The data set of 101-innovations-research-tools-survey includes all survey responses from 20663 researchers all over the world. The data size is too huge which also contains irrelevant information regarding my questions. Thus, to narrow down the scope, I need to further break our questions to specific parts:
- What kinds of tools/sites are researchers using when they want to search relative content?
- Are they able to get free access to these tools/sites?
- Are people from all countries using the same tools/sites?
- Could there be a relationship between research role and tools/sites of using?
- Could there be a relationship between research category and tools/sites of using?
- Do researchers support the idea of open access?
- Could there be a relationship between the researcher's nationality and support of open access?
After I have these breakdowns, I am able to select specific data accordingly.
Data Reconstruction using JMP Pro
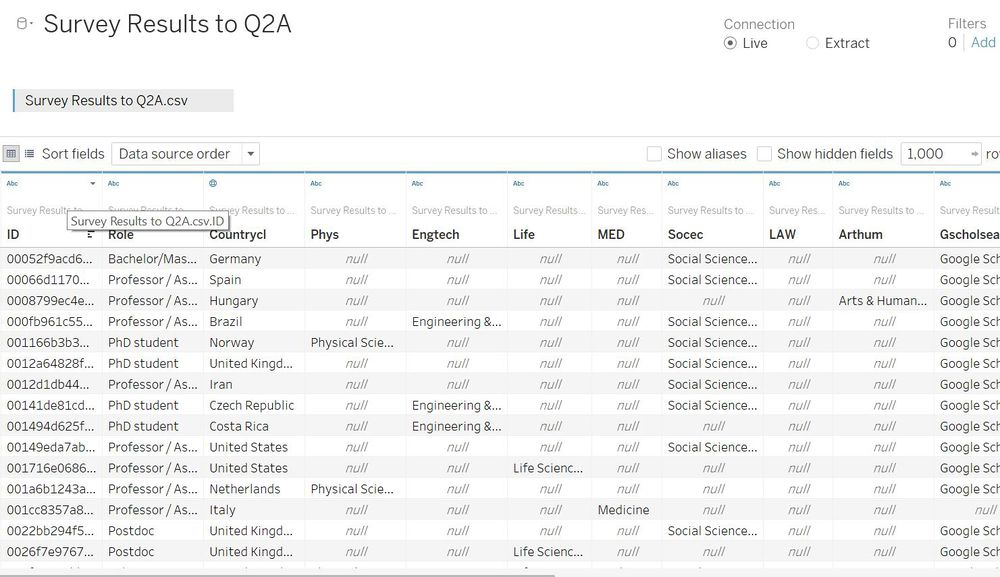
After open survey_cleaned_variable_list.csv, I can see all survey questions. To address my breakdown questions mentioned above, I am only interested in survey questions 1A, 1B, 1C, 2A, 2B and 8B. Questions 1A, 1B and 1C reflect respondents' personal information whereas 2A, 2B and 8B reflect respondents' responses to specific questions. Using "Subset" method in JMP Pro to crop part of the table,

I will construct the following 3 new data sets:
- Question 2A: What tools/sites do you use to search literature/data ?
Similar to the first table, we construct two more sub-tables for :
- Question 2B: What tools/sites do you use to get access to literature/data ?
- Question 8B: Do you support the goal of Open Access?
Analysis & Visualization Construction Process
The following content will show how different visual analytics techniques are being applied and how we use these visual tools to analyze the data.
Question 2A
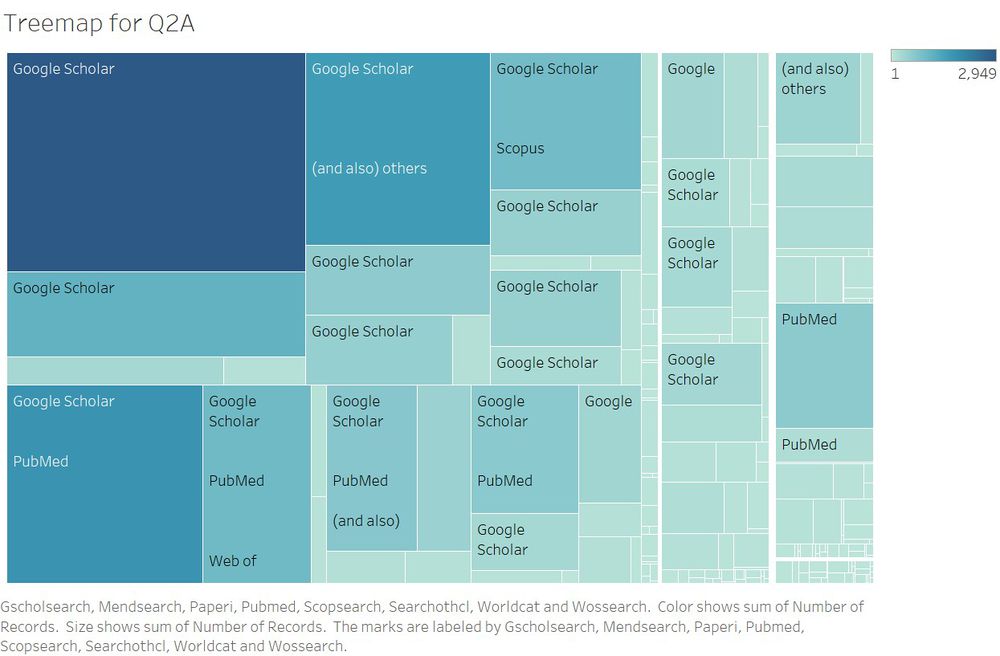
In order to gain a overview on what kinds of tools/sites researchers are using to search, we would first plot a treemap:

Tools
- Tableau Desktop 10.0
- JMP Pro 12
