IS428 2016-17 Term1 Assign2 Wu Wei
Contents
Theme of Interest
Have you ever heard of the term "Open Access"[1]? If you have never heard about it, I guess you have never tried to get access to those scholarly articles or professional reports online. It is a painful experience when you finally find a research paper relates to your group project on Google Scholar but which requires a purchase to access. Personally, I have such experiences occasionally in many of my school project researches. This is a reason why I am a strong supporter of Open Access Movement[2]. Open Access Movement is the worldwide effort to provide free access to scientific and scholarly researches. In 2013, the US government "issued United States' Federal Agencies with more than $100 million in annual R&D expenditures to develop plans within six months to make the published results of federally funded research freely available to the public within one year of publication" [3]. Other countries like China, Russia, Japan, India and etc, all trying to achieve open access for individuals. Thus, my questions comes out: How is the progress of Open Access Movement? Are we getting fruitful results? Or are we currently in a bottleneck phase indeed?
Find Appropriate Data
Breakdown of questions
The data set of 101-innovations-research-tools-survey includes all survey responses from 20663 researchers all over the world. The data size is too huge which also contains irrelevant information regarding my questions. Thus, to narrow down the scope, I need to further break our questions to specific parts:
- What kinds of tools/sites are researchers using when they want to search relative content?
- Are they able to get free access to these tools/sites?
- Are people from all countries using the same tools/sites?
- Could there be a relationship between research role and tools/sites of using?
- Could there be a relationship between research category and tools/sites of using?
- Do researchers support the idea of open access?
- Could there be a relationship between the researcher's role and support of open access?
After I have these breakdowns, I am able to select specific data accordingly.
Data Reconstruction using JMP Pro
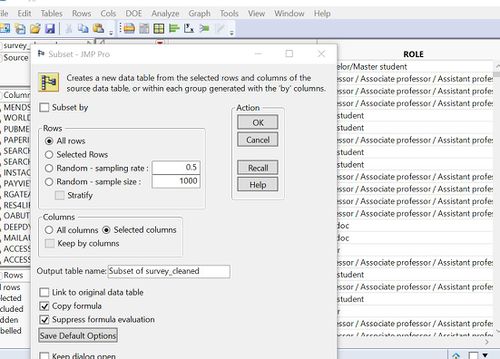
After open survey_cleaned_variable_list.csv, I can see all survey questions. To address my breakdown questions mentioned above, I am only interested in survey questions 1A, 1B, 1C, 2A, 2B and 8B. Questions 1A, 1B and 1C reflect respondents' personal information whereas 2A, 2B and 8B reflect respondents' responses to specific questions. Using "Subset" method in JMP Pro to crop part of the table,
I will construct the following 3 new data sets:
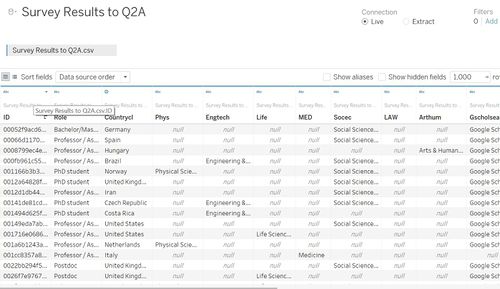
- Question 2A: What tools/sites do you use to search literature/data ?
Similar to the first table, we construct two more sub-tables for :
- Question 2B: What tools/sites do you use to get access to literature/data ?
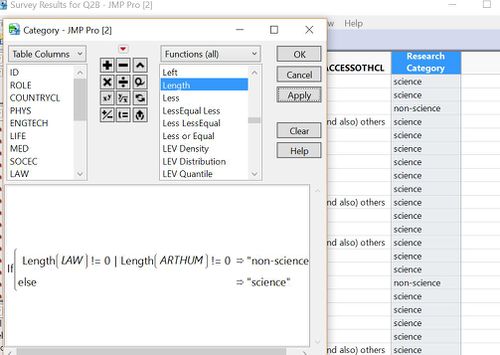
Here, in order to make the data clear, I would create a new column called "Research category" and put "Physical Sciences", "Engineering & Technology", "Life Sciences", "Medicine", "Social Sciences & Economics" as "science" under category; "Law" and "Arts & Humanities" as "non-science".
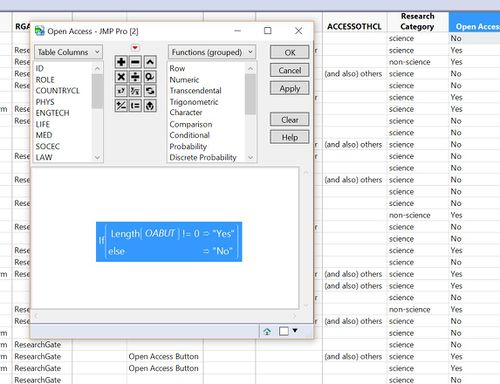
By applying the same logic, I create another new column called "Open Access", by doing so I will be able to only get "Yes" for open access button while for the rest of the cases, I would just leave them as "No".
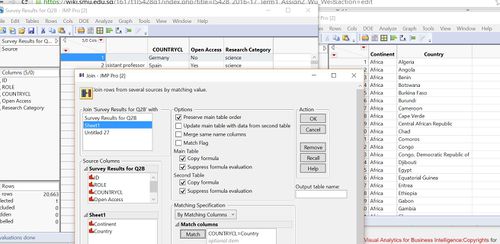
Then, I categorize all countries as continents by matching a country excel file where contains all countries and its corresponding continent. Now we get a new column for all continents.
- Question 8B: Do you support the goal of Open Access?
Analysis & Visualization Construction Process
The following content will show how different visual analytics techniques are being applied and how we use these visual tools to analyze the data.
Question 2A
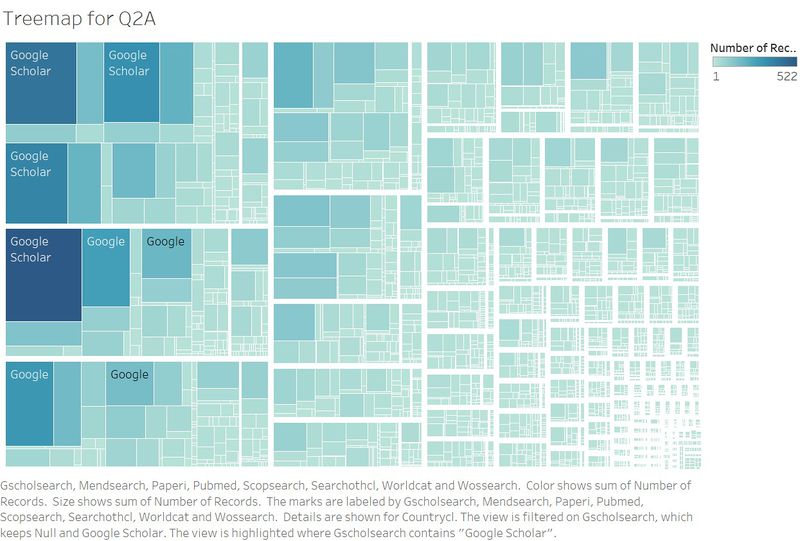
In order to gain a overview on what kinds of tools/sites researchers are using to search, we would first plot a treemap:
From the treemap, we can see Google Scholar is still the top choice when researchers conduct a search. However, Google Scholar is not always free. Sometimes, people can view a few pages rather than get the full version of the article. Other common choices like Mendsearch, Web of Science, Scopus need the users to log in by using the institutional account. Indeed it is also not free as institutions generally pay a lot of money to buy institutional accounts. At the same time, not everyone in the institution can get a unique account. Most of time, people need to share a few accounts and the number of logins are also limited by the server side. Current situation still shows a lack of unified open access for most researchers.
Now, we can add "Country" in the treemap to compare differences across all countries.
Although among all countries, Google Scholar is the major searching method; we still can see differences in case of percentage when we compare all countries. Countries like the United States, the United Kingdom, Canada and Brazil have almost 90% of respondent researchers who use Google Scholar for searching. Countries like Germany, Italy, Japan and Spain rely less on Google Scholar compare to the previous countries. Additionally, China seems to have the lowest percentage of using Google Scholar. This is obvious where Chinese government banned Google since 2012.
Question 2B
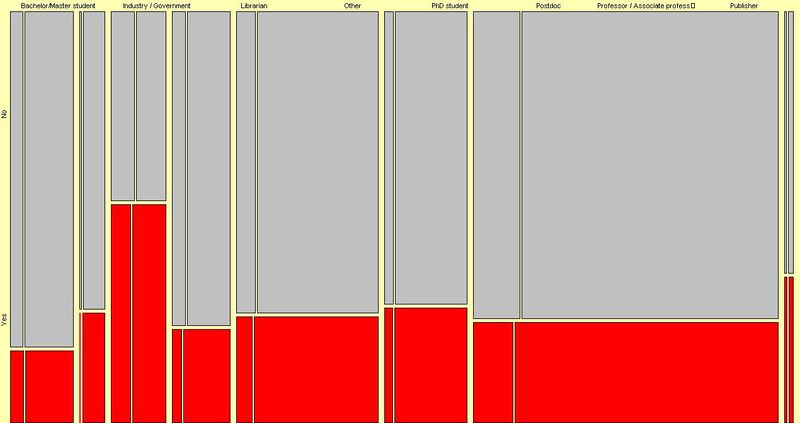
In order to know how researchers from different industry can access through open access button, I decide to plot a Mosaic plot to show the relationship between the role of researcher, research category and access method:
Red area denotes researchers are using open access when they are doing research. Interestingly, I observed that librarians have a much higher percentage compare to other researchers. Nearly half of the librarians know how to take open access. This could reflect that librarians generally receive more training on researching. It is not surprising for them to take this advantage to open access. Meanwhile, bachelor and master students have the lowest percentage among all roles. University students have less research work compare to phD students, professors and research experts, thus they are less aware of using open access to research.
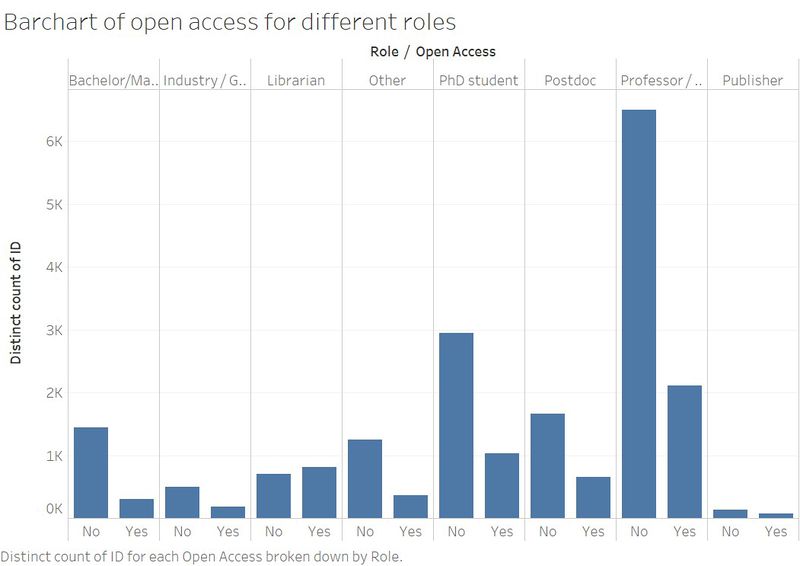
I plot a bar-chart to show open access across different roles as bar chart would enable us to see a clear distribution of data:
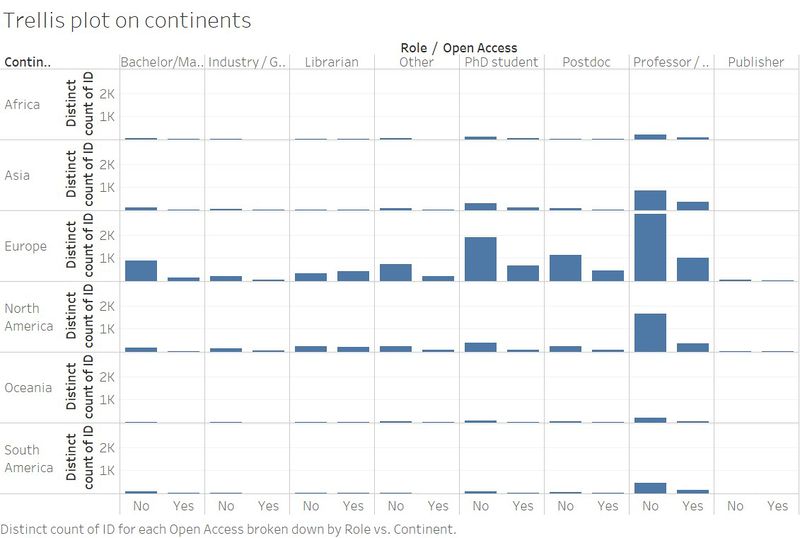
Now, I add continents to gain a trellis graph which enable me to take a closer look across different continents:
When I look at the continent distribution, I found that the data is indeed very biased:
- The data set has limited sample for publisher and industry/government;
- The data set has limited sample for most continents except Europe;
This can be a limitation of analysis results as it is not a good representation for a worldwide researchers.
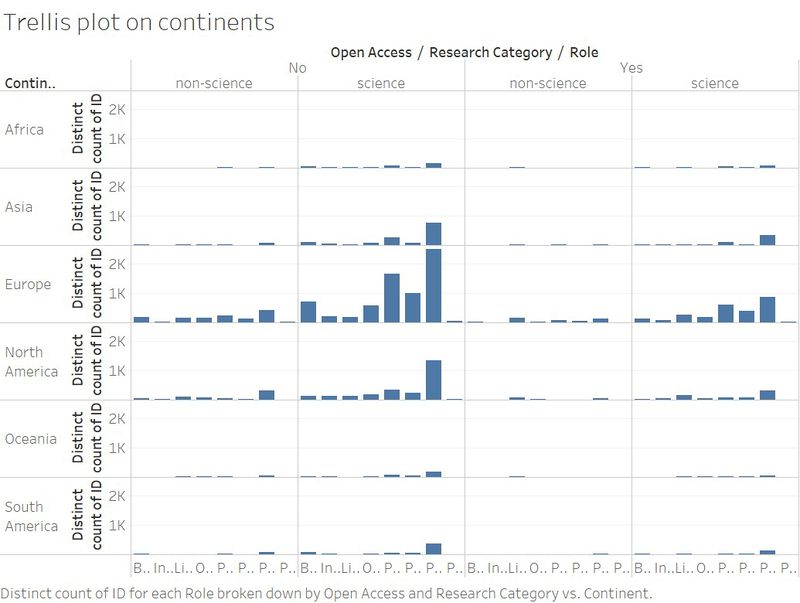
After I add research category on x-axis, it is more obvious to see the comparison between science industry and non-science industry:
From this plot, I can see more results indeed lie in the science category. The trend of non-science industry is negligible as the sample size is too small in this case. The analysis from this project does not apply to non-science research discipline.
Question 8B
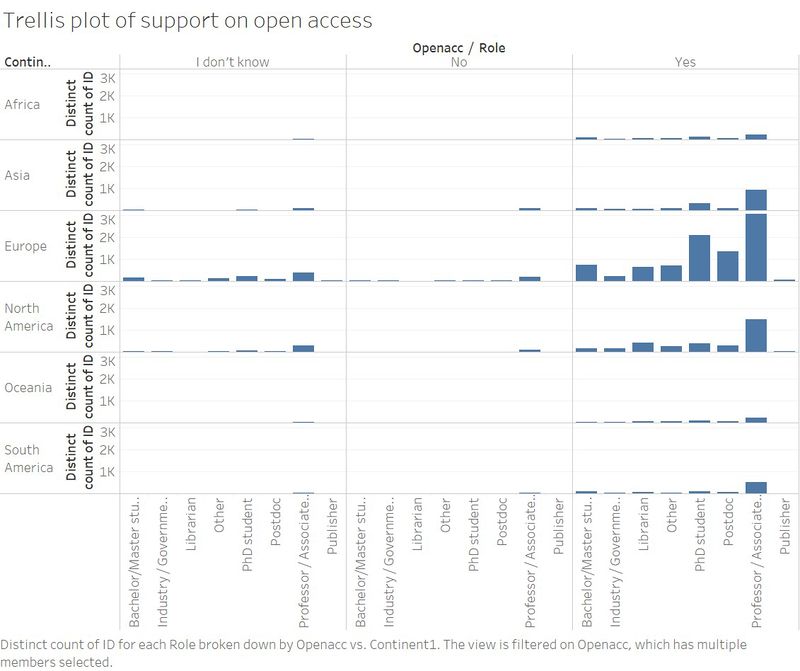
When I only count the valid responses from 8B (not include null answer), I get a Trellis plot as following:
Majority in any of research disciplines are supporting open access, whereas a small percentage of people still remain unsure or negative. Professors and assistant professors show a higher percentage of decline open access among all roles. However, due to the large sample size of professors compare with other role samples, this observation is not valid.
Conclusions
From the Innovations in scholarly communication survey results analysis, I would say that open access is still not adopted by the majority researchers. Although some open access tools/websites are available, researchers, especially bachelor researchers are unaware of these tools/websites. Most researchers remain optimistic in the future open access development while minority resist the idea of open access. Due to the biased sampling regarding region and industry, there would be no conclusions related.
Tools
- Tableau Desktop 10.0
- JMP Pro 12
- Mondrian 15b
