Difference between revisions of "IS428 2016-17 Term1 Assign1 Zheng Xiye"
| Line 25: | Line 25: | ||
Chart plotted above illustrates change in percentage of total no.of completed and sold private properties across 4 quarters of 2015. Both of which reflect reducing heat in private property supply as indicated by the down-going percentage trend. Assuming that the reducing heat is not attributed to a seasonal effect and positive correlation between total completed and sold, we are able to conclude that private property supply will continue to shrink in 2016. | Chart plotted above illustrates change in percentage of total no.of completed and sold private properties across 4 quarters of 2015. Both of which reflect reducing heat in private property supply as indicated by the down-going percentage trend. Assuming that the reducing heat is not attributed to a seasonal effect and positive correlation between total completed and sold, we are able to conclude that private property supply will continue to shrink in 2016. | ||
| + | ==== Private Property Sale Type Overview ==== | ||
| + | Merged data on Residential Supply includes 6 types of Private Properties in total namely: | ||
| + | #Condominiums | ||
| + | #Executive Condominiums | ||
| + | #Detached | ||
| + | #Semi-Detached | ||
| + | #Apartments | ||
| + | #Terrace | ||
| + | However, I noticed some of the categories (i.e. Semi-Detached & Executive Condominiums) include very few number of inputs. As a result, I decided to merge categories: Condominiums & Executive Condominiums, Detached & Semi-Detached by making use of Tableau's 'Create Calculated Field' function. | ||
| + | [[File:Private Property Type Sale.JPG]] | ||
| + | |||
| + | By referring to the chart plotted, it is obvious that Condominiums and Apartments account for most of the Private Property Sales across 4 quarters of 2015. On top of which, the general decreasing trend in Private Property Sales should be attributed to the decrease in the number of Condominium Sales, followed by Apartment Sales. | ||
Revision as of 01:27, 29 August 2016
Contents
Abstract
Problem & Motivation
With limited amount of land available for construction and high demand for private properties, Singapore has always been a 'low-hanging fruit' for real-estate players to gain substantial benefits from constructing and selling excessive number of private properties.

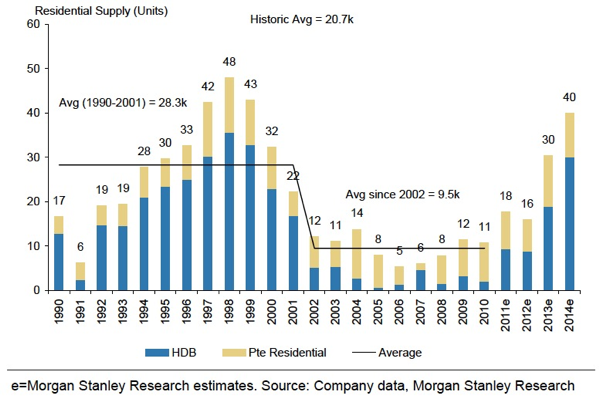
By referring to Morgan Stanley Research on Singapore Residential Supply, private properties supply reached its peak around millennium, decreased to historical minimum around 2008 Global Economic Crisis and re-bounced to around 40K units in 2014. The rapidly inflating real-estate market flashed 'red-light' upon Singapore government, urging policy makers to structure regulating measures in preventing the 'real-estate bubble' from bursting.
In order to facilitate policy makers' decision making process, this study aims to identify both supply and pricing patterns of private properties across the entire Singapore. By doing so, policy makers will be having a 'touch and feel' on the landscape of real-estate market. Effectively identifying real-dangers and potential risks, policy makers will be empowered to structure preventive mitigation actions accordingly, which ensures the well-being of Singapore real-estate market.
Tools
- Microsoft Excel: mainly for data pre-processing: data cleaning, sorting and transforming.
- Tableau 10.0: creating charts that effectively identify patterns hidden in huge data-sets and providing insights that may be proven helpful in facilitating policy makers' decision making process.
Approaches
Private Property Sale Overview 2015
After merging data downloaded from REALIS namely: Residential Supply 2015 q1-q4, I came to realize that in order to trace the trend of private property sale across 2015, an additional column, Quarter is required.
Chart plotted above illustrates change in percentage of total no.of completed and sold private properties across 4 quarters of 2015. Both of which reflect reducing heat in private property supply as indicated by the down-going percentage trend. Assuming that the reducing heat is not attributed to a seasonal effect and positive correlation between total completed and sold, we are able to conclude that private property supply will continue to shrink in 2016.
Private Property Sale Type Overview
Merged data on Residential Supply includes 6 types of Private Properties in total namely:
- Condominiums
- Executive Condominiums
- Detached
- Semi-Detached
- Apartments
- Terrace
However, I noticed some of the categories (i.e. Semi-Detached & Executive Condominiums) include very few number of inputs. As a result, I decided to merge categories: Condominiums & Executive Condominiums, Detached & Semi-Detached by making use of Tableau's 'Create Calculated Field' function.
By referring to the chart plotted, it is obvious that Condominiums and Apartments account for most of the Private Property Sales across 4 quarters of 2015. On top of which, the general decreasing trend in Private Property Sales should be attributed to the decrease in the number of Condominium Sales, followed by Apartment Sales.