IS428 2016-17 Term1 Assign1 Zheng Xiye
Contents
Abstract
This report aims to illustrate data exploration results found with data visualization tools and techniques that focus on various factors contributing towards Supply & Price of Private Properties. Insights grasped from this process may be proven beneficial in facilitating the decision making process of policy makers and ultimately influencing the structuring of government polices in the real-estate industry.
Problem & Motivation
With limited amount of land available for construction and high demand for private properties, Singapore has always been a 'low-hanging fruit' for real-estate players to gain substantial benefits from constructing and selling excessive number of private properties.

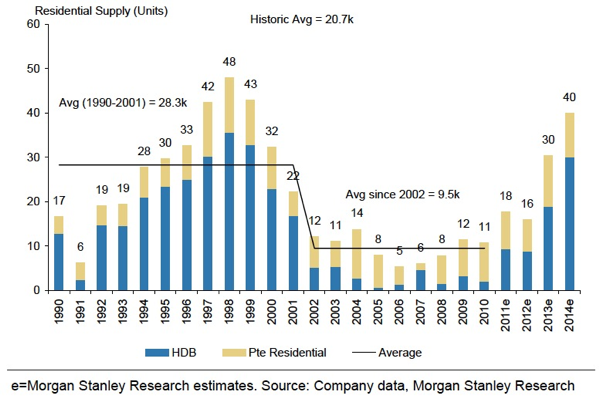
By referring to Morgan Stanley Research on Singapore Residential Supply, private properties supply reached its peak around millennium, decreased to historical minimum around 2008 Global Economic Crisis and re-bounced to around 40K units in 2014. The rapidly inflating real-estate market flashed 'red-light' upon Singapore government, urging policy makers to structure regulating measures in preventing the 'real-estate bubble' from bursting.
In order to facilitate policy makers' decision making process, this study aims to identify both supply and pricing patterns of private properties across the entire Singapore. By doing so, policy makers will be having a 'touch and feel' on the current fast-changing landscape of real-estate market. Effectively identifying real-dangers and potential risks, policy makers will be empowered to structure preventive mitigation actions accordingly, which ensures the well-being of Singapore real-estate market.
Tools
- Microsoft Excel: mainly for data pre-processing: data cleaning, sorting and transforming.
- Tableau 10.0: creating charts that effectively identify patterns hidden in huge data-sets and providing insights that may be proven helpful in facilitating policy makers' decision making process.
- Piktochart: drafting infographics - responsible for providing a clear and easy way of communicating findings in the data exploration process.
Approaches
Private Property Sale Overview 2015
After merging data downloaded from REALIS namely: Residential Supply 2015 q1-q4, I came to realize that in order to trace the trend of private property sale across 2015, an additional column, Quarter is required.
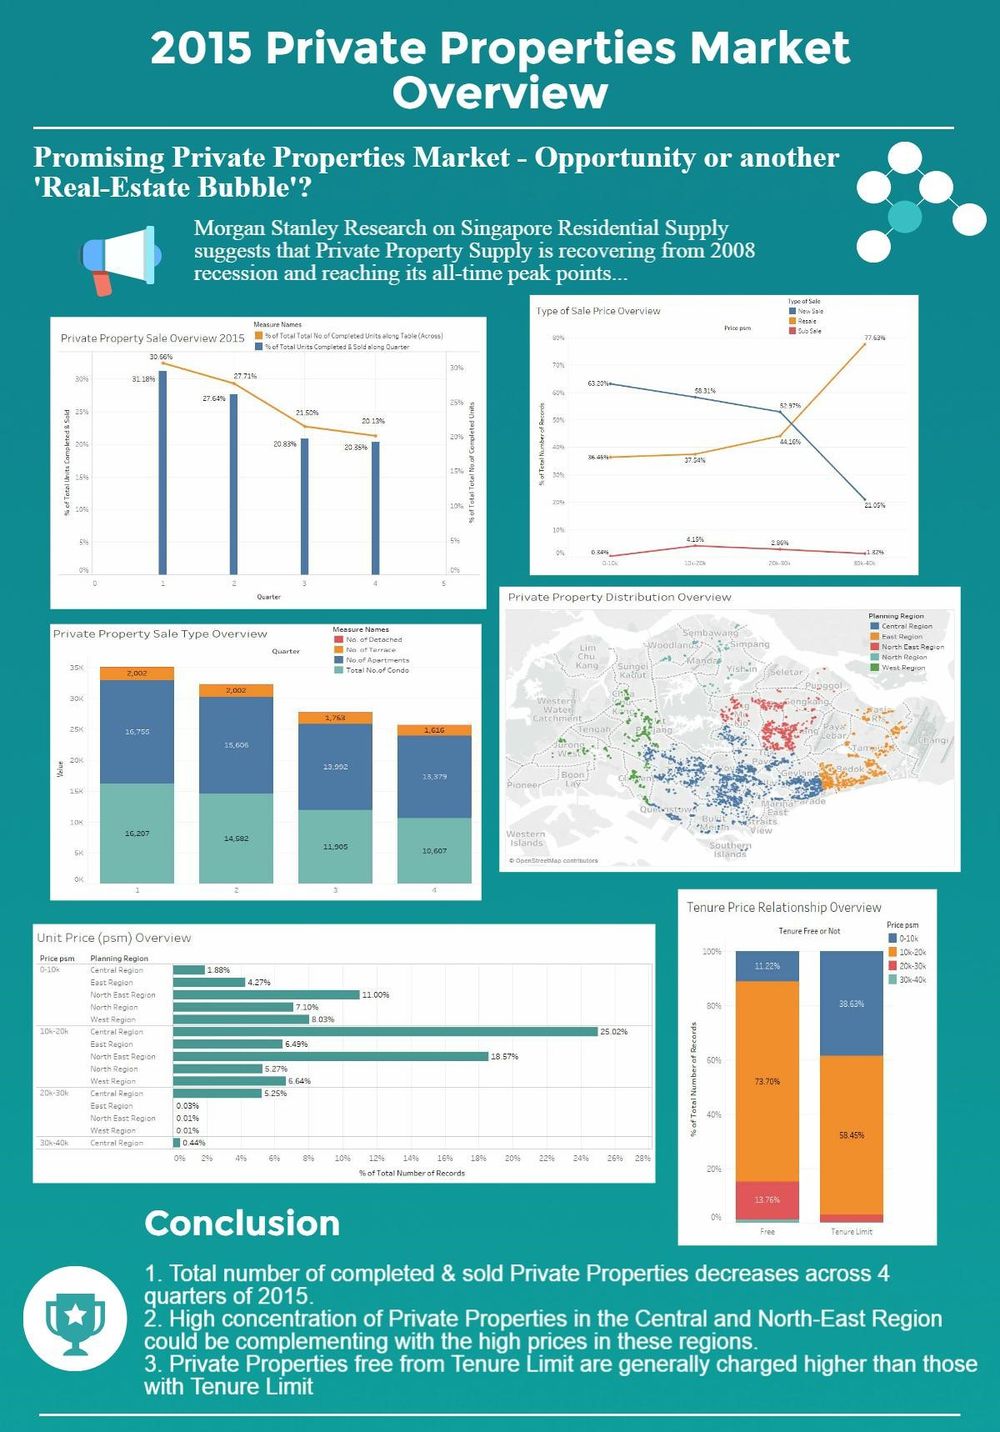
Chart plotted above illustrates change in percentage of total no.of completed and sold private properties across 4 quarters of 2015. Both of which reflect reducing heat in private property supply as indicated by the down-going percentage trend. Assuming that the reducing heat is not attributed to a seasonal effect and positive correlation between total completed and sold, we are able to conclude that private property supply will continue to shrink in 2016.
Private Property Sale Type Overview
Merged data on Residential Supply includes 6 types of Private Properties in total namely:
- Condominiums
- Executive Condominiums
- Detached
- Semi-Detached
- Apartments
- Terrace
However, I noticed some of the categories (i.e. Semi-Detached & Executive Condominiums) include very few number of inputs. As a result, I decided to merge categories: Condominiums & Executive Condominiums, Detached & Semi-Detached by making use of Tableau's 'Create Calculated Field' function.
By referring to the chart plotted, it is obvious that Condominiums and Apartments account for most of the Private Property Sales across 4 quarters of 2015. On top of which, the general decreasing trend in Private Property Sales should be attributed to the decrease in the number of Condominium Sales, followed by Apartment Sales.
Private Property Geographic Distribution
After plotting base map with given Longitude and Latitude Measures, I have placed Dimension Postal Code as Detail so as to plot all Private Property locations on the base map. After which, I have placed Planning Region Dimension under Color such that all Private Property Plots on the base map will be colored accordingly. As shown in the chart plotted, Private Properties are clustered around their geographic locations. Yet, cluster density around Central and North East Region is substantially higher than that of other regions, suggesting these 'best-sell' areas contributing to the steadily increasing Private Property Sale.
Distribution of Private Property Price 2015
Planning Region Unit Price (psm) Overview
After browsing through merged Transaction datasheet, I found that all both Unit Price ($psf) & Unit Price ($psm) are whole numbers. If I were to plot all of which to any chart without pre-processing it, I will be dealing with tens of thousands of Unit Prices. As such, I have again made use of Tableau's 'Create Calculated Field' function based on Unit Price ($psm) to merge all Unit Prices into 4 categories namely:
- 0-10k
- 10k-20k
- 20k-30k
- 30k-40k
After which, I managed to plot a horizontal bar chart with both Dimensions: Price psm & Planning Region as Rows and SUM(Number of Records) as Columns.
Looking into each of the Price psm categories, I noticed that Central Region is leading in terms of price count percentage in most of the high Price (psm) categories followed by North-East Region. As such, we are able to imply that the high sale quantity in both Central & North-East Region can be attributed to the high selling price in both regions.
Tenure Price Relationship Overview
Column Tenure of merged Transaction datasheet is a case by case situation whereby thousands of tenure limits are included in the column. As such, by adopting the same approach as the previous analysis, I have created a new calculated field: "Tenure Free or Not". As the name suggests, it includes two categories:
- Free
- Tenure Limit
After which, I placed newly created 'Tenure Free or Not' field in Columns, SUM(Number of Records) in Rows and 'Price psm' in Color.
Plotted chart shows that generally Private Properties free from tenure need to pay higher price as compared to those with tenure limit. This is reflected by 'Free' category's low percentage of 0-10k psm and high percentage of 10k-20k and 20-30k psm.
Type of Sale Price Relationship Overview
Common perception perceives that New Sale Prices of any items will be higher than that of Resale Prices. In order to test to what extent this perception holds, I have placed 'Price psm' as Columns, SUM(Number of Records) as Rows and 'Type of Sale' as Color. It is worth-noting that 'Type of Sale' has already been classified into three categories:
- New Sale
- Resale
- Sub Sale
First of all, Sub Sale will not be taken into consideration since it remains low and stable in all 'Price psm' categories. 'New Sale' category percentage remains higher than 'Resale' category percentage for 0-30k (combined) category, which aligns with the common perception. However, there is a drastic increase in 'Resale' category percentage and drastic decrease in 'New Sale category percentage in the 30-40k category. This implies that 'Resale' price only remain lower than 'New Sale' price prior to 30k psm for most Private Properties. After which, its psm will be substantially higher than that of 'New Sale'.
Inforgraphics
Conclusion & Suggestions
- On a timeline basis, total number of completed & sold Private Properties decreases across 4 quarters of 2015. Such decreasing trend could essentially be attributed to the substantial decrease in both Total No.of Condos & No.of Apartments. From the policy makers' perspective, they should investigate to find out whether such decrease is primarily due to the annual quarterly decrease pattern. If so, they should look out for drastic increase in Private Property Sale in early 2016 and structure more stringent rules & regulations in seek of inflating Private Property Price in the real-estate market.
- From a geographical perspective, high concentration of Private Properties in the Central and North-East Region could be complementing with the high prices in these regions [high demand (price) driving high supply or vice versa]. Instead of trying to figure out the 'Chicken Egg Problem' - which one comes first, policy makers should look out for Private Property Construction Project from these areas, set price ceilings and control number of Construction Project in these regions.
- From the real-estate industry's perspective, Private Properties free from Tenure Limit are generally charged higher than those with Tenure Limit, which is in line with Singapore government's interests. However, policy makers should look into factors leading to Resale having substantially higher prices than New Sale in the 30k-40k price psm category. This measure aims to resolve potential market distortions and inflation as a result of 'behind-the-scene' dealing between property owners.
