Difference between revisions of "IS428 2016-17 Term1 Assign1 Wang Jingxuan"
Jx.wang.2013 (talk | contribs) |
Jx.wang.2013 (talk | contribs) |
||
| Line 33: | Line 33: | ||
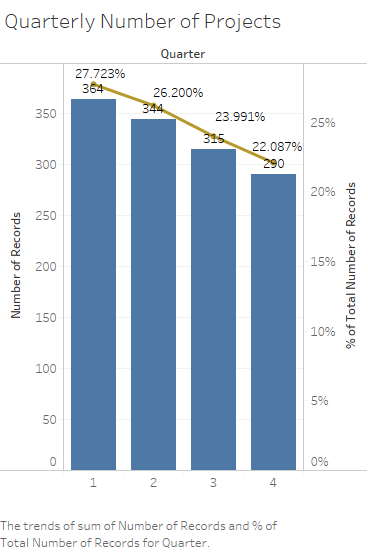
[[Image:Quarterly_property_projects.png]]<br/> | [[Image:Quarterly_property_projects.png]]<br/> | ||
[[Image:Quarterly_property_transactions.png]]<br/> | [[Image:Quarterly_property_transactions.png]]<br/> | ||
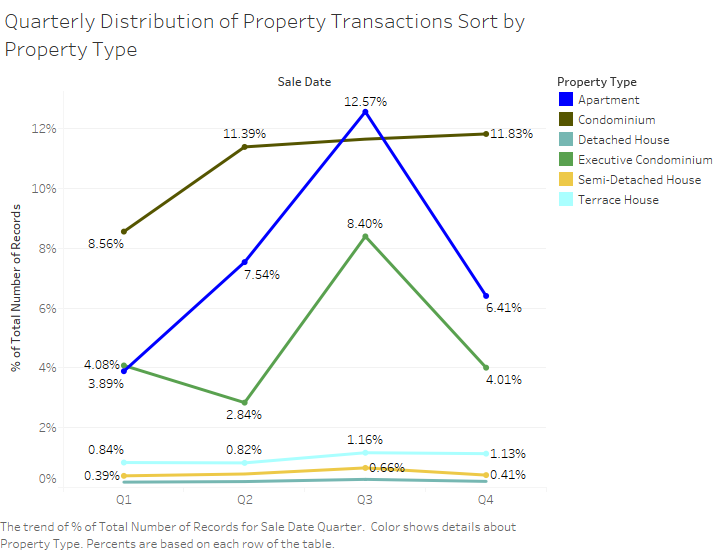
| + | [[Image:Transactions_of_property.png]]<br /> | ||
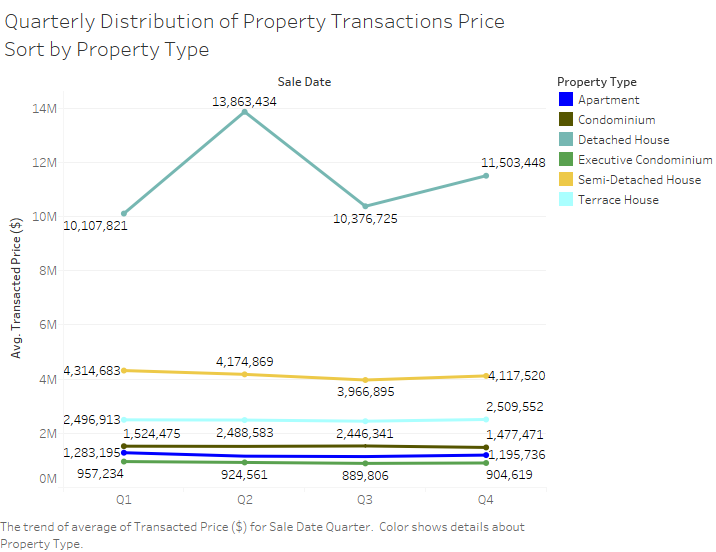
[[Image:Quarterly_transaction_price.png]]<br/> | [[Image:Quarterly_transaction_price.png]]<br/> | ||
| − | |||
| − | |||
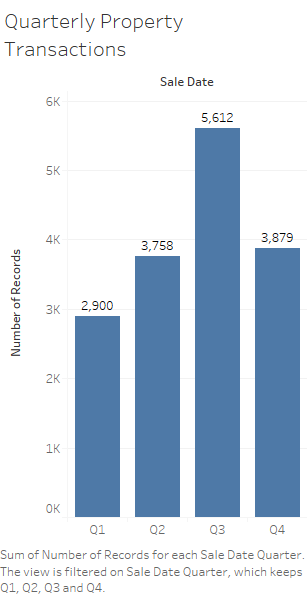
This graph shows number of transactions over 4 quarters. The first quarter contains least number of transactions, and the 3rd quarter contains the largest number of transactions.<br /> | This graph shows number of transactions over 4 quarters. The first quarter contains least number of transactions, and the 3rd quarter contains the largest number of transactions.<br /> | ||
Revision as of 03:17, 29 August 2016
Contents
Abstract
Problem & Motivation
We know that private property pricing in Singapore has been rather high due to its land limit, and its government has introduced a series of cooling measures. Some people believe in the value of private property, some people say the value of property is decreasing. Through exploring the private property supply and demand in 2015, we want to answer these questions:
- For buyers, is it a good time to invest in private property, what and where should they invest?
- For policy makers, is it a good time to further constrain the supply of property, and what type of property?
Tools
Approaches
Data Selection and Preparation
Data Source: The data sources selected are:
- Transactions of Private Residential Property in 2015
- Quarterly Supply of Private Residential Properties in 2015
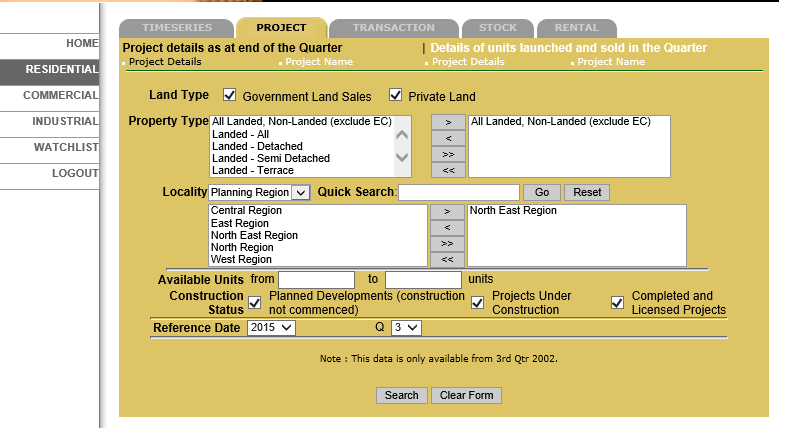
There is no raw data for supply grouped by dates, region and area. In order to collect data from database REALIS, I have to select region then select quarter. It was very troublesome as I can only download one file of data in one region or area during one quarter, then I combined and merged all the downloaded files together as integrated data for exploration.
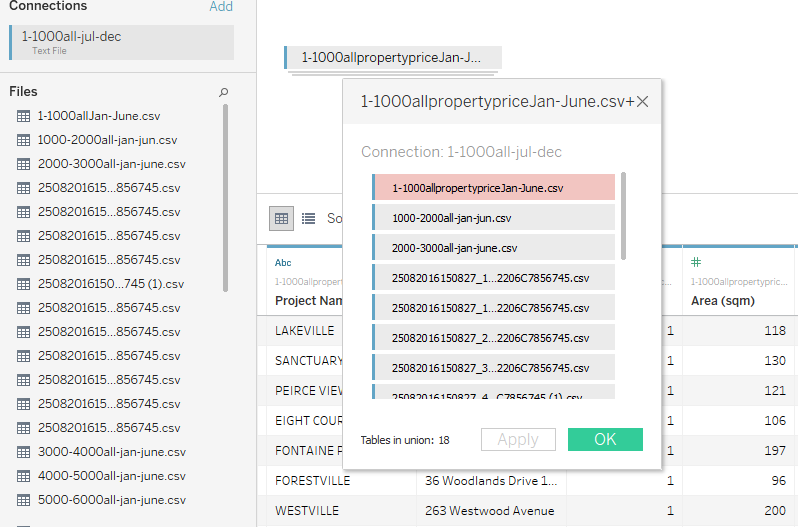
The downloaded transactions are in 18 files so when I explored data, I have to union them.
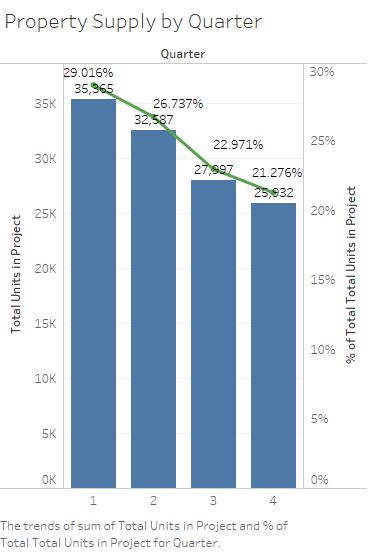
The quarterly supply of private residential properties downloaded are in 4 csv files, and each file contains a quarterly supply data. However quarterly supply data does not contain quarter number so I added in quarter parameter in csv files, then I unioned them with tableau.
General Trend
Transactions of property in 2015 directly answered our most concerning question:how was property selling and buying in 2015?
This graph shows number of transactions over 4 quarters. The first quarter contains least number of transactions, and the 3rd quarter contains the largest number of transactions.
