IS428 2016-17 Term1 Assign1 Wang Jingxuan
Contents
Abstract
The project aims to explore private property market in 2015. The main focus here is supply and pricing of private property. The findings and perspectives may facilitate policy makers to have a better view and insight of private property market, and possibly help them make decisions.
Problem & Motivation
We know that private property pricing in Singapore has been rather high due to its land limit, and its government has introduced a series of cooling measures. Some people believe in the value of private property, some people say the value of property is decreasing. Through exploring the private property supply and demand in 2015, we want to answer these questions:
- For buyers, is it a good time to invest in private property, what and where should they invest?
- For policy makers, is it a good time to further constrain the supply of property, and what type of property?
Tools
- Excel 2013 for data preparation
- Tableau 10.0 for charts and graphs
- Piktochart for infographics
Approaches
Data Selection and Preparation
Data Source: The data sources selected are:
- Transactions of Private Residential Property in 2015
- Quarterly Supply of Private Residential Properties in 2015
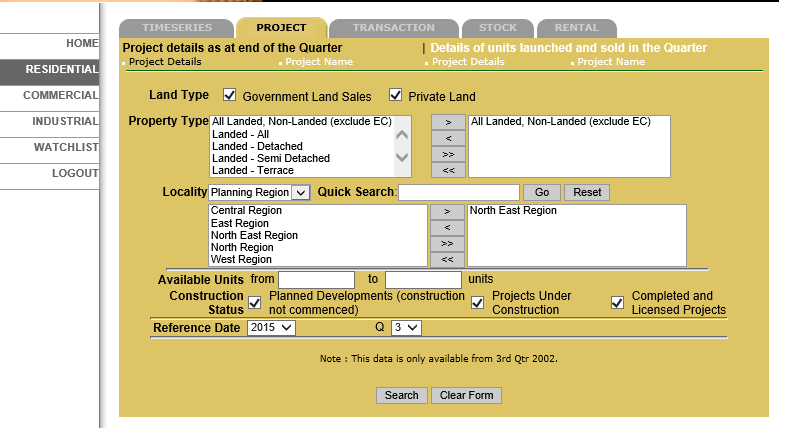
There is no raw data for supply grouped by dates, region and area. In order to collect data from database REALIS, I have to select region then select quarter. It was very troublesome as I can only download one file of data in one region or area during one quarter, then I combined and merged all the downloaded files together as integrated data for exploration.
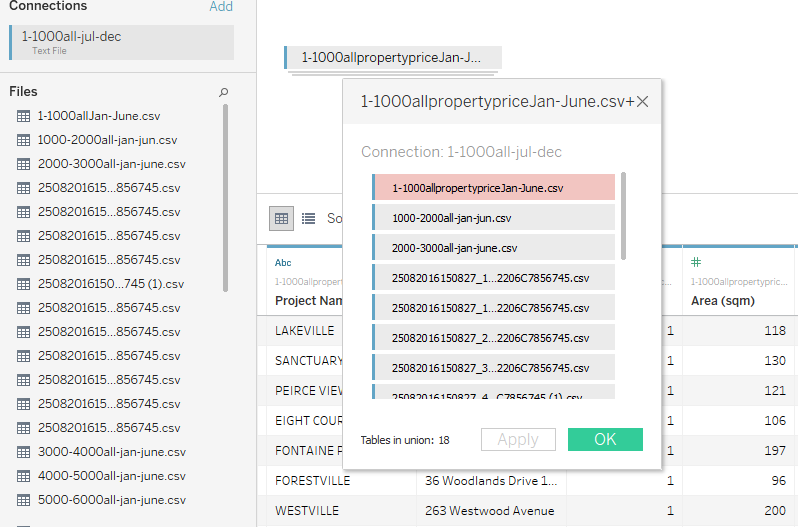
The downloaded transactions are in 18 files so when I explored data, I have to union them.
The quarterly supply of private residential properties downloaded are in 4 csv files, and each file contains a quarterly supply data. However quarterly supply data does not contain quarter number so I added in quarter parameter in csv files, then I unioned them with tableau.
General Trend
Transactions of property in 2015 directly answered our most concerning question:how was property selling and buying in 2015?
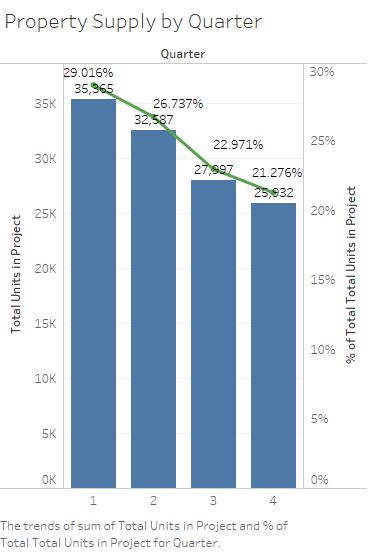
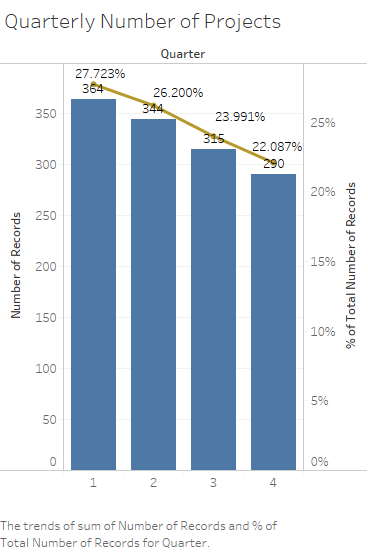
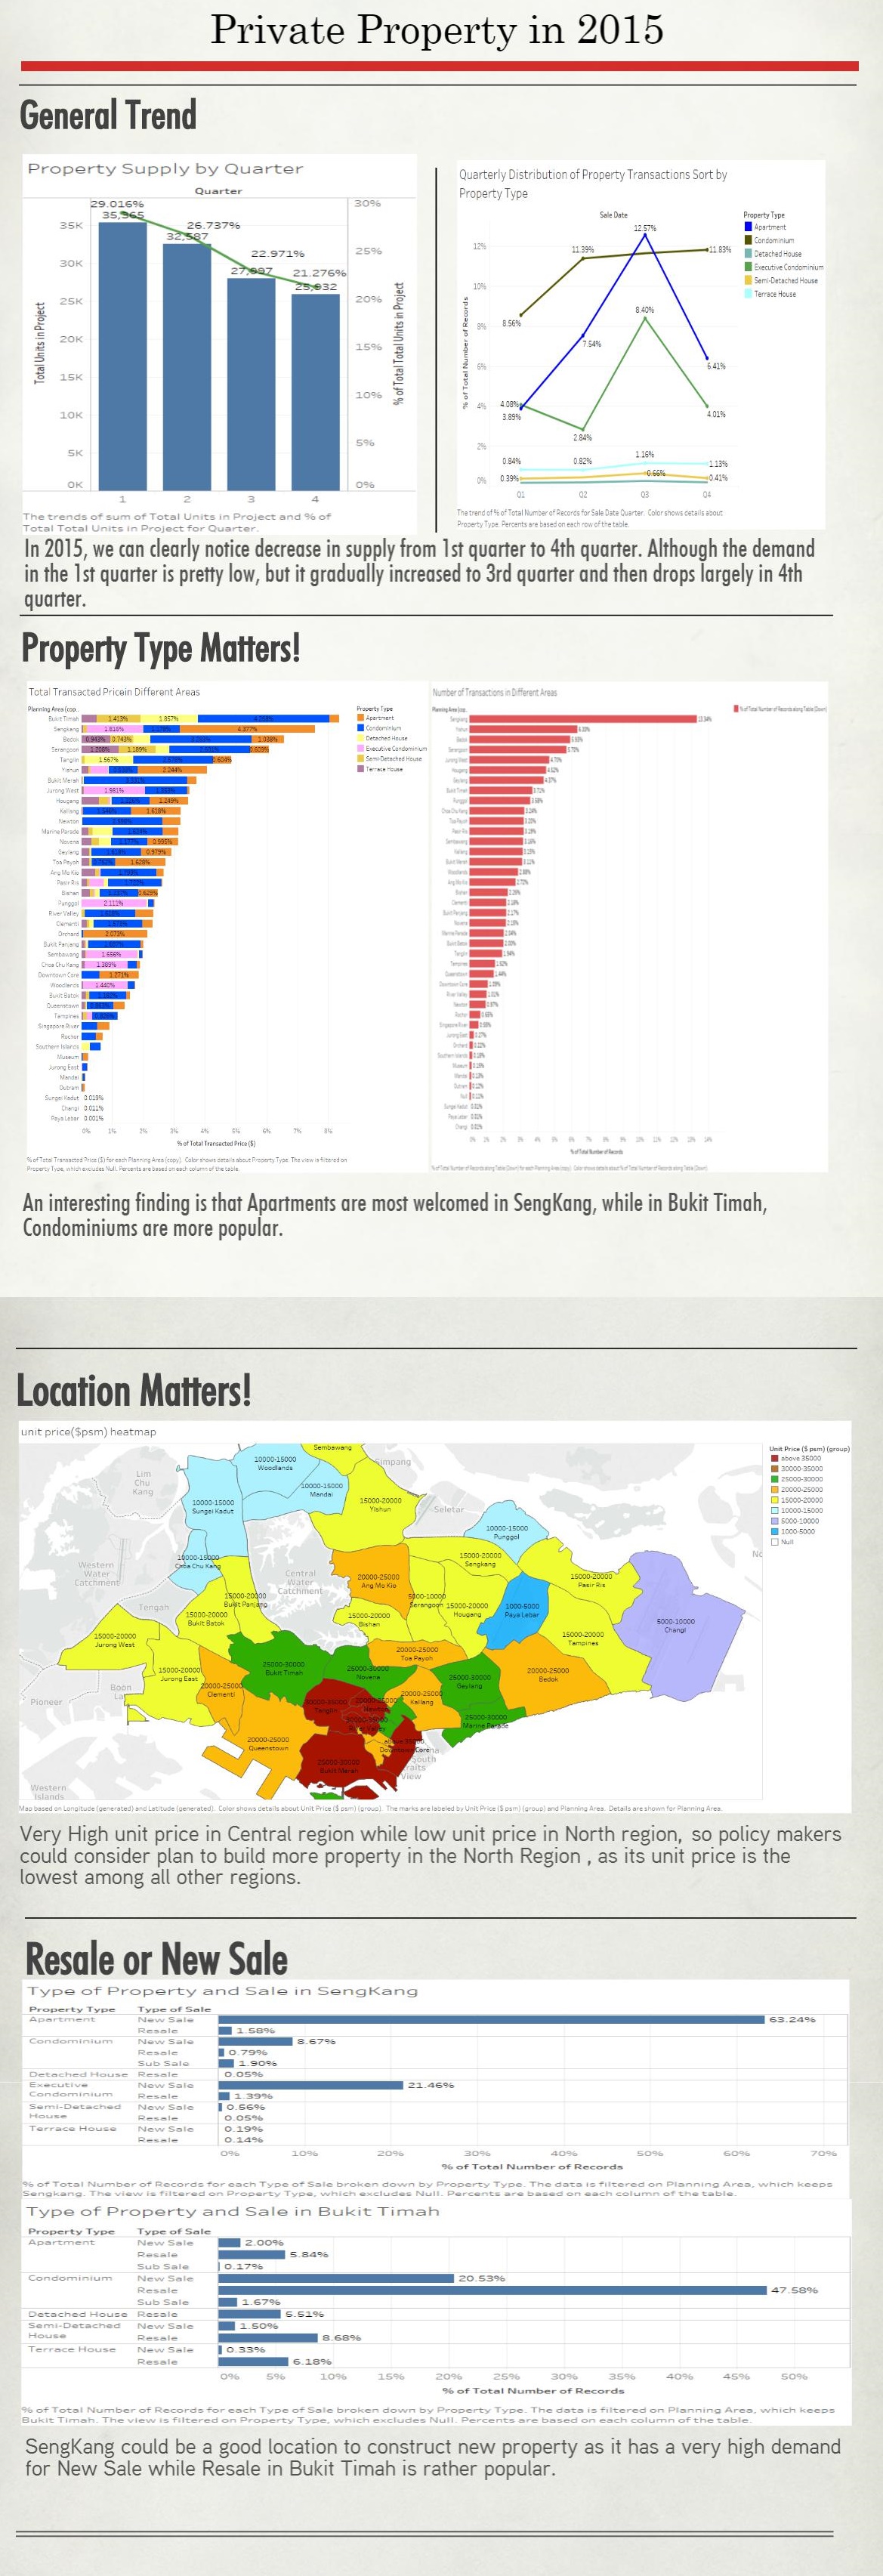
In order to view how supply distributed over 4 quarters in 2015, bar charts are used to clearly demonstrate how supply changes over time. And percentage of decrease or increase are also shown. Total units in projects keeps dropping from 29.0% to 21.3% over 4 quarters. And the total number of projects are also decreasing from 27.7% to 22.0% over 4 quarters. The decreasing trend of both total units and total number of projects indicates a slow down in property supply in 2015.
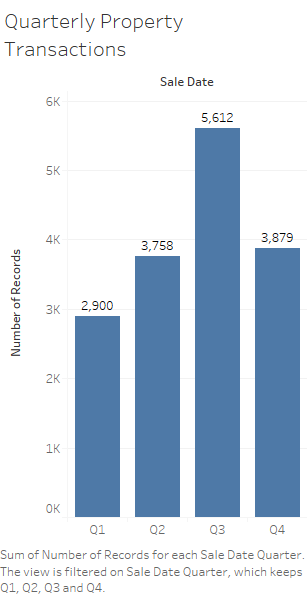
Bar charts are used to show how number of transactions distributed among 4 quarters in 2015. The number of transactions increased from 1st quarter to 3rd quarter then greatly decreased in 4th quarter. But what causes the decrease in 4th quarter?
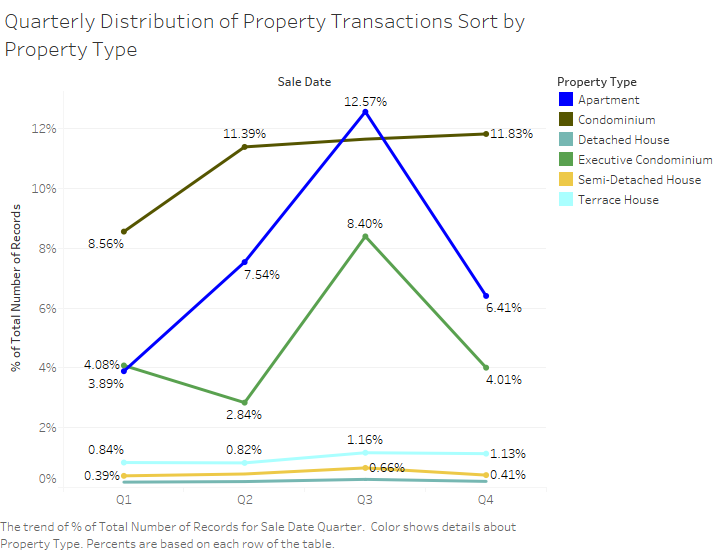
In order to explore what causes the sudden decrease in number of transactions in 4th quarter, I further break down data into categories of property type. Different colors are used to represent different property types. And from the graph we can tell that the number of transactions of Condominium greatly increased from 8.6% to 11.4% in 2rd quarter then slightly increased to 11.8% in 4th quarter. However apartment drops about 6% in 4th quarter and Executive Condominium drops about 4.4% in 4th quarter, while the rest property types remains the same. One assumption could be the increase in pricing of Apartment and Executive Condominium.
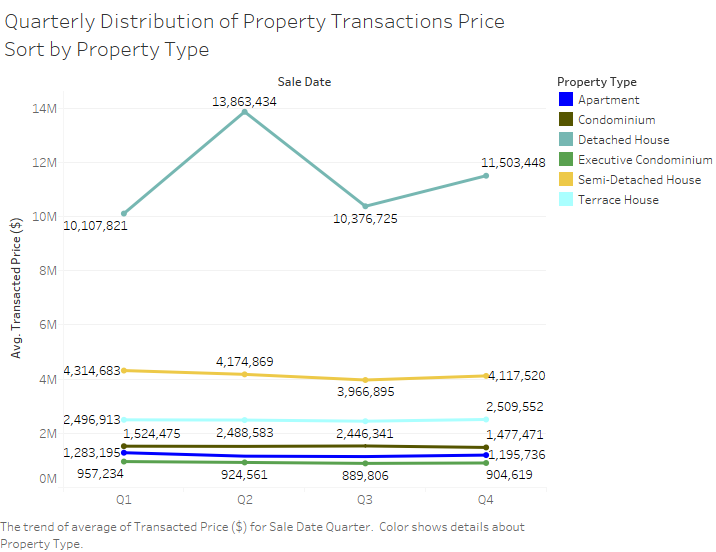
In order to explore pricing changes over time, averaged pricing is used and line graph could easily show the changes over time. The graph shows that the drop of number of transactions of Apartment and Executive Condominium is possibly not caused by increase in their pricing, as shown by the graph their pricing remains quite stable while pricing of Detached House is going up and down.
Geographical Location
Location is a big concern when we want to buy or sell property. A good location usually mean good value and great potential, and usually a good location is far more expensive. In order to demonstrate how expensive is a good location, a unit price heatmap is used. And i colored different areas based on unit price groups.
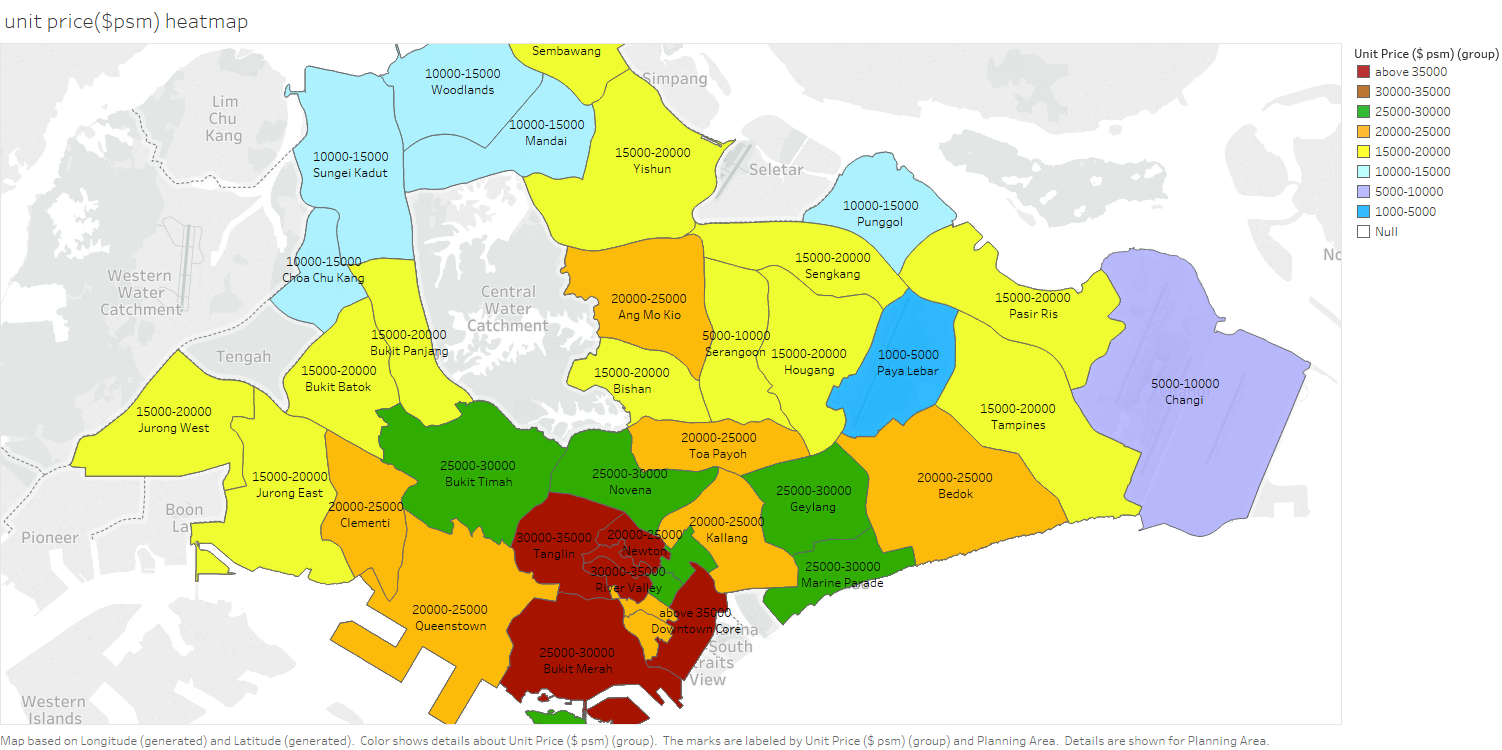
As graph shown a central location is "hotter" than others, indicating a much higher unit price.
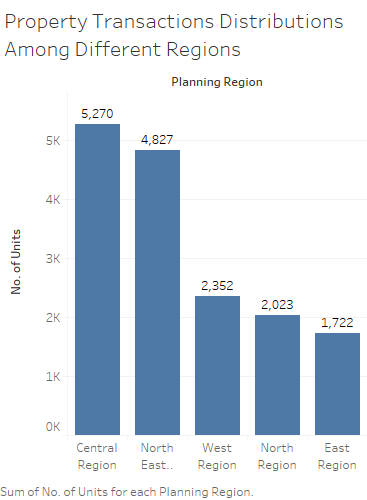
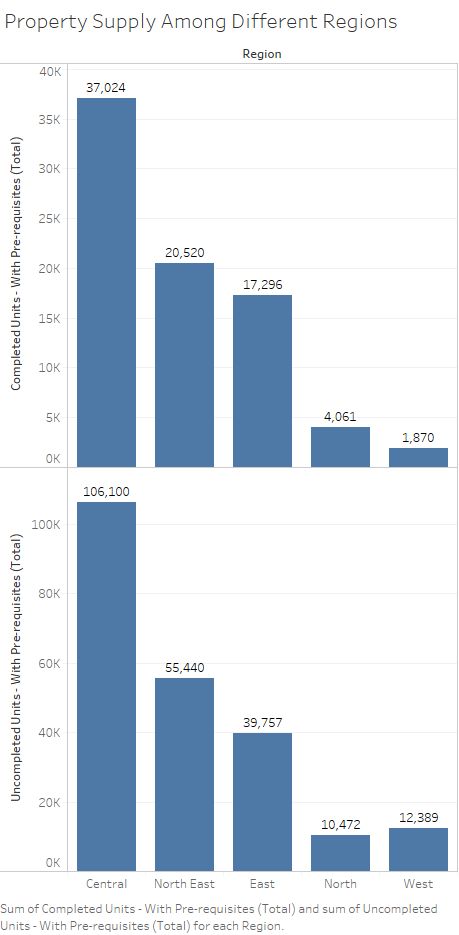
Good locations are both property sellers and property buyers want to fight for. As shown in the charts, regional_property_transactions.png, most of transactions occur in central region, and charts, regional_property_supply.png shows that central region contains largest number of both completed and uncompleted units. Of course, central area is the good location, and when we compare the supply and the demand(number of transactions), we notice there are still a large number vacancies of property, meaning there is excessive supply of property. Then why there is excessive supply of property in such a good location, in central region? One assumption is that the unit price could be too high and not everyone could afford it.
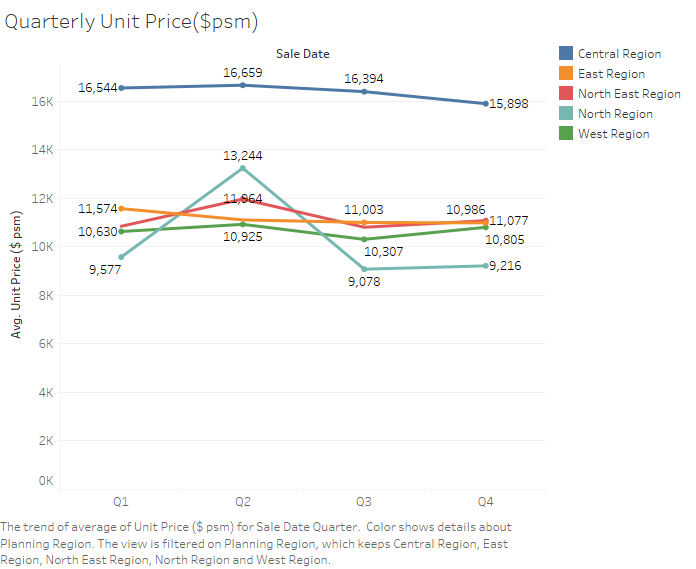
Form the graph, it is possibly true that the one of the causes of excessive supply in central area is because of high pricing. I plotted averaged unit pricing of different types of property distributed among 4 quarters. By looking at the above charts, we could easily find out that the pricing of central region is so much more expensive than the rest, and the pricing of central area keeps relatively stable.
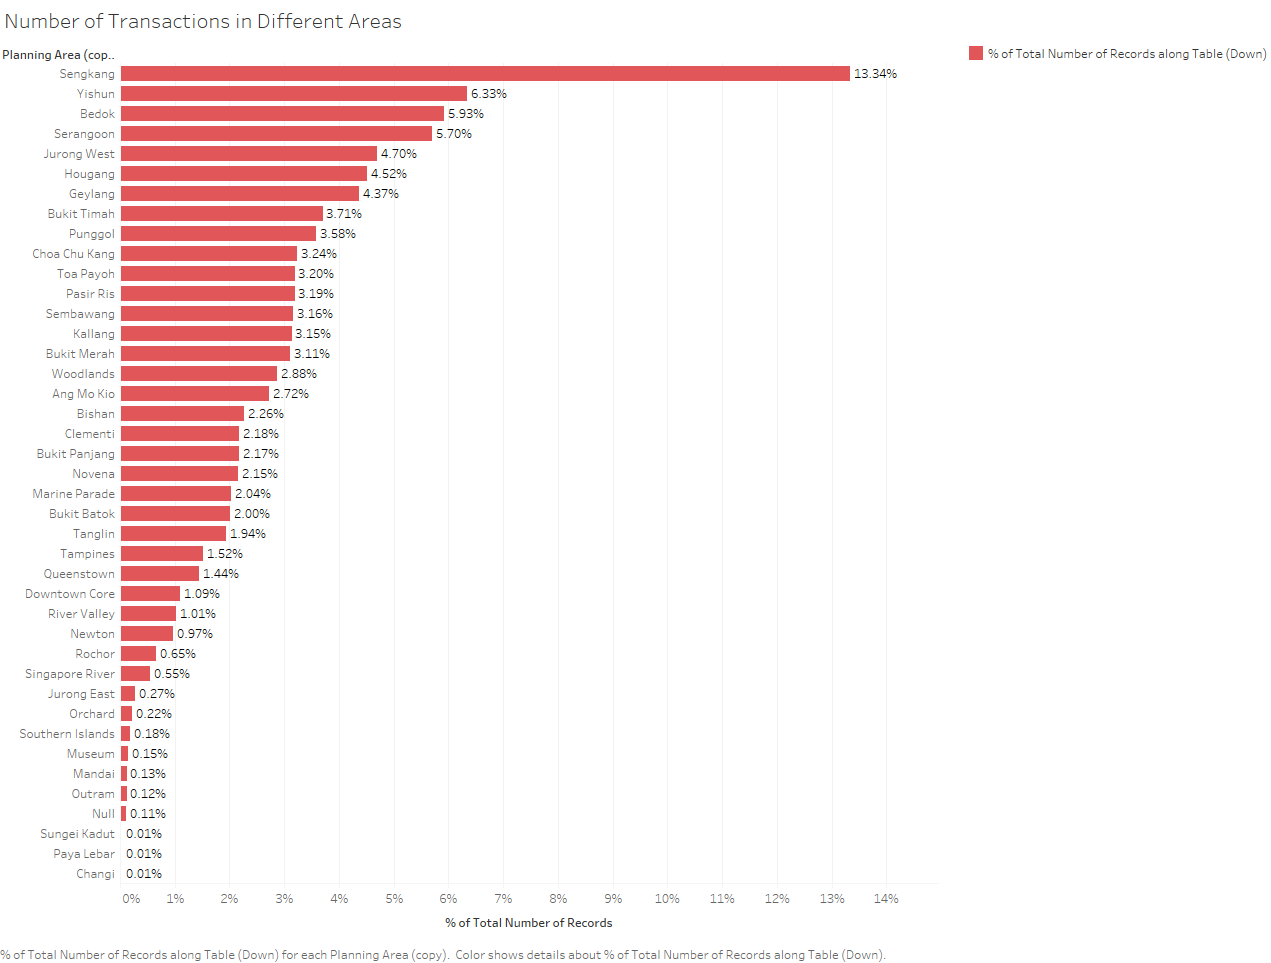
To further drill down to different areas, I found out SengKang is the place contains largest number of transactions.
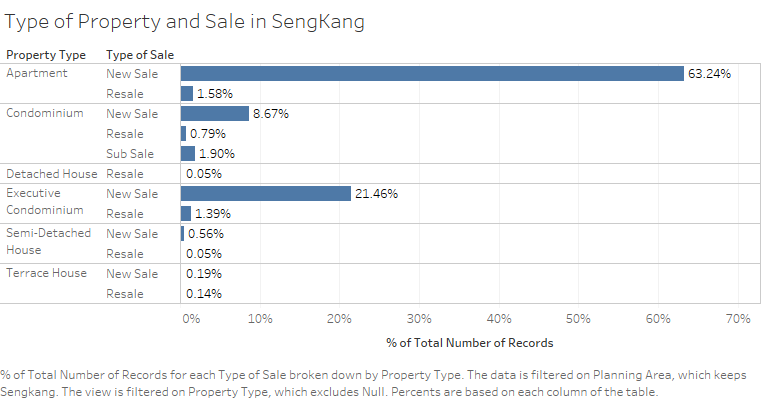
To further drill down to sale types of SengKang, it is shown in the graph that new sale in SengKang is the largest component.
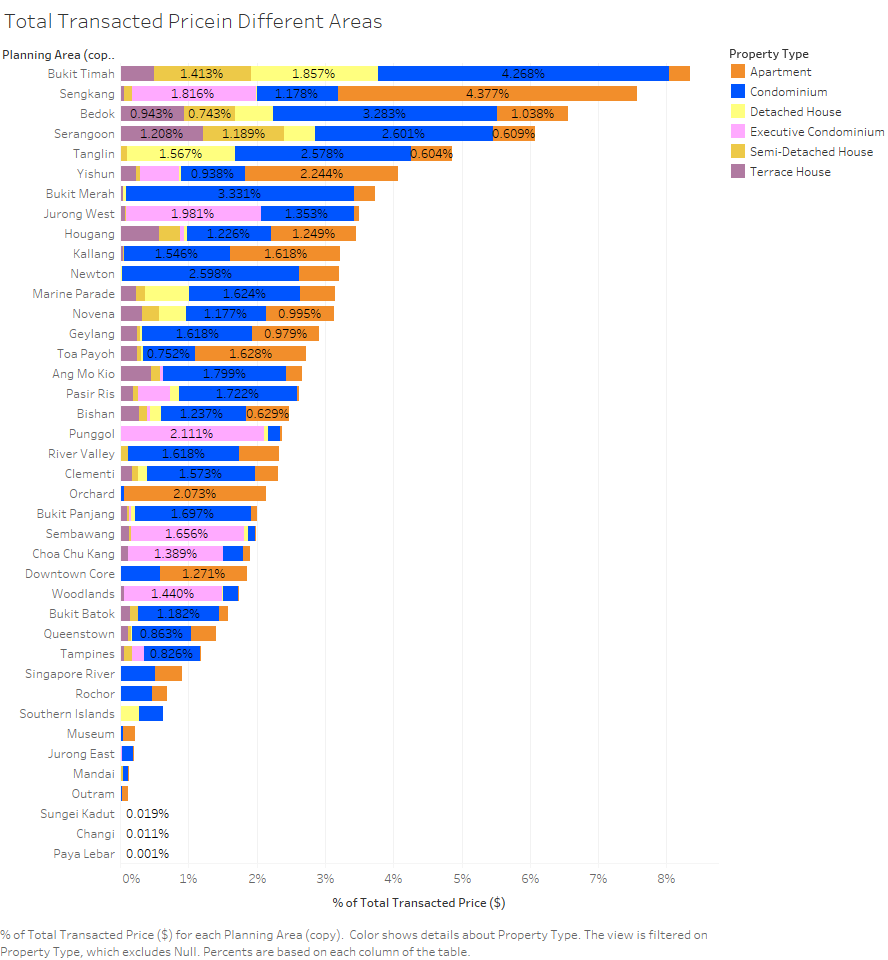
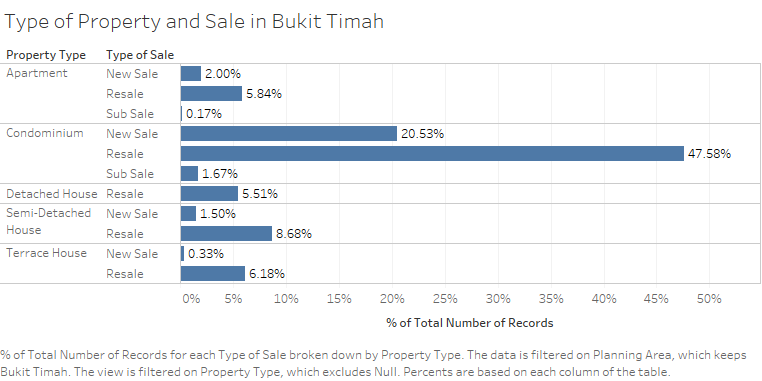
On the other hand, if we looking at Total transacted price, Bukit Timah is the place contains largest number of total transacted price, while SengKang becomes the second largest. By coloring different property types, it is shown that Apartment is the main type of property in SengKang, while Condominium is the main type of property in Bukit Timah. By further studying Bukit Timah's sale type in the chart below. Over 47.6% (Most number) of transactions in Bukit Timah are done by resale.
Conclusions and Recommendations
The cooling measures have been effective in recent years. In 2015, we can clearly notice decrease in supply from 1st quarter to 4th quarter. Although the demand in the 1st quarter is pretty low, but it gradually increased to 3rd quarter and then drops largely in 4th quarter. A sudden drop in 4th quarter is rather abnormal, as policy makers, they should investigate and find out the reason behind this issue.
It has been an excessive supply of property, but why people still cannot afford property? One of the causes is because of excessive supply of property in central region, while the pricing of central region kept extremely high. So policy makers could consider plan to build more property in the North Region , as its unit price is the lowest among all other regions. Meanwhile policy makers could consider set constrains to those property firms in order to limit number of property constructed in central area.
Another interesting finding is that new apartments are most welcomed in SengKang, while in Bukit Timah, resale of condominium is more popular. And number of people buying condominium was gradually increasing in 2015. So SengKang could be a good location to construct new property as it has a very high demand for new sale.
