Visualizing Electricity Consumption in Singapore: Data Preparation
Jump to navigation
Jump to search
Initial Data Set
Data Cleaning
Public Housing Data
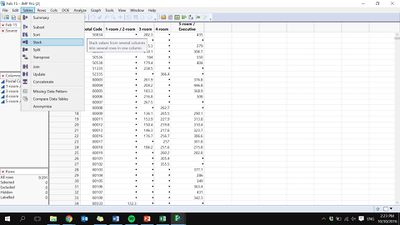
Step 1: Go to Tables > Stack

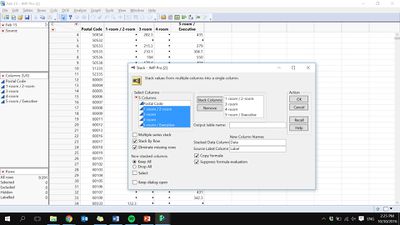
Step 2: Select the following columns, check “Stack by rows” and “Eliminate missing rows”

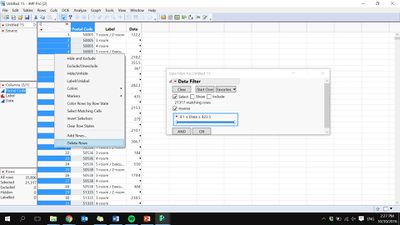
Step 3: Filter out and delete rows with missing values

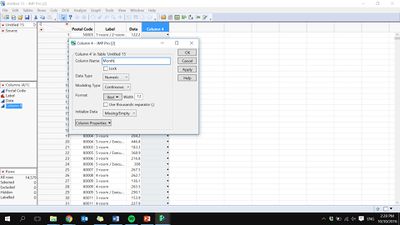
Step 4: Create “Month” Column

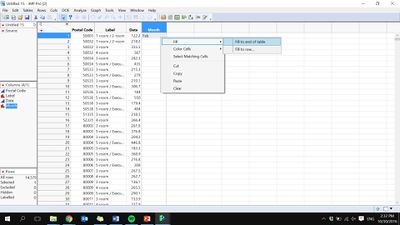
Step 5: Fill month till the end of table

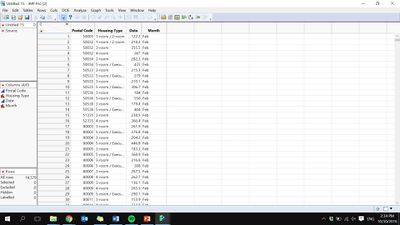
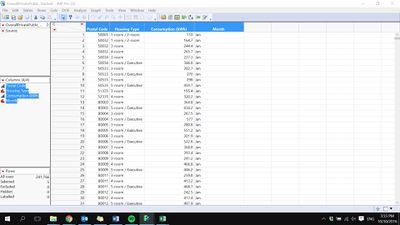
Step 6: Final Output

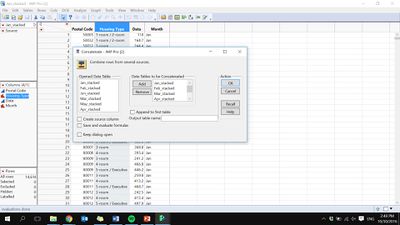
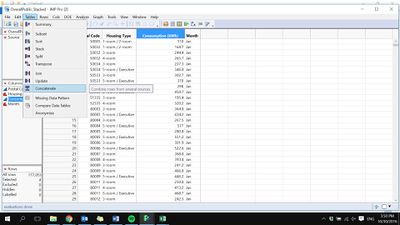
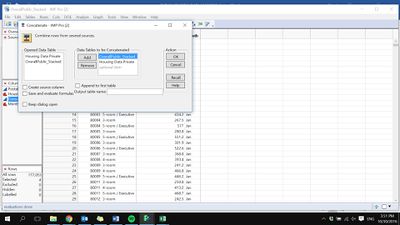
Step 7: Repeat the following process for all the month’s data Step 8: Go to table > Concatenate > Select all the months

Step 9: By the end of the data cleaning, we have a total of 177,053 rows Step 10: Merging Private Housing Data with Public Housing Data


Final consolidated data consist of 241,766 rows
