Team Shooting Stars: Proposal
Contents
Background & Motivation
The National Basketball Association (NBA) is one of the most famous sports league in the world. It consists 30 men basketball teams (where 29 in the US, 1 in Canada) which was founded in 1940s, named BAA (Basketball Association of America). Then it changed to the current name of NBA after merging with NBL (National Basketball League) in 1949. NBA plays are generally fast-paced, physically intensive where audience find it fascinating to watch. NBA also represents the best basketball play standard in the world. Joining NBA is the ultimate dream for a professional basketball player.
As NBA fans, our group would like to analyse on player’s statistics and team’s performance to clear our doubts like how the play styles of NBA basketball have been changed over the last 10 years. We would apply different visualization tools and graphics to gain in-depth analysis.
Project Description
The aim of this project is to get deeper knowledge into the current trend in NBA and what makes a team succeed, so the questions we are going to answer are:
1. Is the role of centre becoming less and less important in NBA?
2. How do the defense and offense factors of a team vary and determines a team's success?
3. What are the important quality that leads to a player's success?
4. Does the presence of a superstar and a bigger budget lead to the success of the team?
Data Set Selection
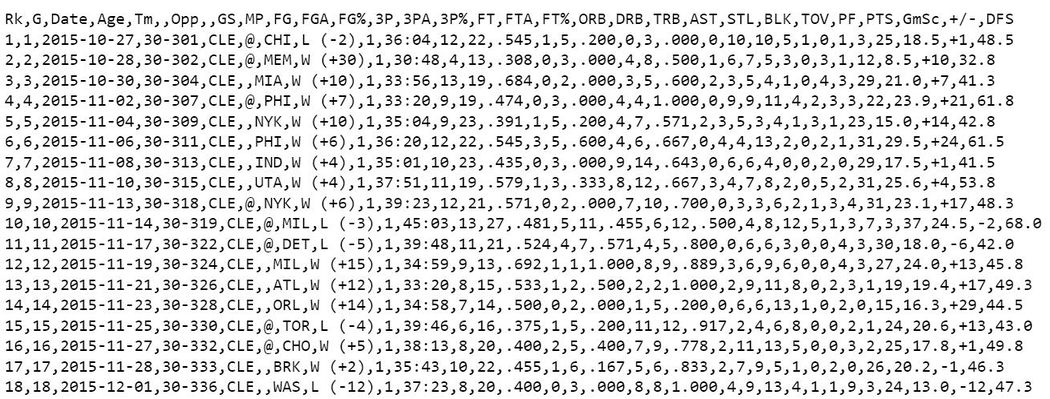
We retrieved our data from Basketball Reference. The data is in CSV format where each game contains two CSVs files. For example, the following two CSVs represent the box scores of Cleveland Cavaliers vs Golden States Warriors on June 19, 2016:
Moreover, we also can retrieve a specific player's game statistics in a certain timeline from this site:
For our VA project, we plan to retrieve all players data in the past 10 years. We would also categorize the game statistics according to the game type (normal season, playoff, finals). The data size is quite large so we will use JMP to do data transformation and combination.
Schedule
| Academic Studying Week | Task | Done By | Status | |||
| Week 7 | ||||||
| 1 | Brainstorm project topic and scope | Everyone | Completed | |||
| Week 8 | ||||||
| 1 | Formulate ideas | Everyone | Completed | |||
| 2 | Consulting Prof | Wu Wei, Wang Ziteng | Completed | |||
| 3 | Deciding on tools/techniques to use | Wang Ziteng, Manas Mohapatra | Completed | |||
| 4 | Upload detail project proposal | Wu Wei | Completed
| |||
| Week 9 | ||||||
| 1 | Data preparation, consolidation, preprocessing and cleaning | Everyone | Completed | |||
| Week 10 | ||||||
| 1 | Update Wiki page | Wu Wei, Wang Ziteng | Completed | |||
| 2 | Study Treemap | Wang Ziteng | Completed | |||
| 3 | Study Multi-Series Line Chart | Manas Mohapatra | Completed
| |||
| Week 11 & 12 | ||||||
| 1 | Web App Developer | Everyone | Completed | |||
| Week 13 | ||||||
| 1 | Do poster, presentation preparation | Everyone | Completed | |||
| Week 14 | ||||||
| 1 | Presentation | Everyone | Completed | |||
| Week 15 | ||||||
| 1 | Submission of project poster | Wu Wei | Completed | |||
| 2 | Submission of final project paper and artifacts | Wang Ziteng, Manas Mohapatra | Completed | |||
| Week 16 | ||||||
| 1 | Visual Analytics Poster Night | Everyone | Completed | |||
Tools
Our team decided to use the tools such as JMP, Tableau, d3,js for doing the following analysis:
| Illustration | Analytical Methods |
|---|---|
|
| |
| |
|
Prior Work & References
- Success Factors in NBA: http://www.basketball-reference.com/about/factors.html
- The length and success of NBA careers: Coates, Dennis; Oguntimein, Babatunde. International Journal of Sport Finance 5.1 (Feb 2010): 4-26.
- Racial Discrimination among NBA referees: http://ww2.amstat.org//Chapters/boston/nessis07/presentation_material/Justin_Wolfers.pdf


