IS428 2016-17 Term1 Assign3 Zheng Xiye
Contents
Problem & Motivation
After the successful resolution of the 2014 kidnapping at GAStech’s Abila, Kronos office, GAStech officials determined that Abila offices needed a significant upgrade. At the end of 2015, the growing company moved into a new, state-of-the-art three-story building near their previous location. Even though the employee morale rose somewhat with the excitement of the new building, there are still a few disgruntled employees in the company.
The new office is built to the highest energy efficiency standard, but as with any new building, there are still several HVAC issues to work out. The building is divided into several HVAC (heating, ventilation, and air conditioning) zones. Each zone is instrumented with sensors that report building temperatures, heating and cooling system status values, and concentration levels of various chemicals such as carbon dioxide (abbreviated CO2) and hazium (abbreviated Haz), a recently discovered and possibly dangerous chemical. CEO Sten Sanjorge Jr. has read about hazium and requested that these sensors be included. However, they are very new and very expensive, so GAStech can afford only a small number of sensors.
With their move into the new building, GAStech also introduced new security procedures, which staff members are not necessarily adopting consistently. Staff members are now required to wear proximity (prox) cards while in the building. The building is instrumented with passive prox card readers that cover individual building zones. The prox card zones do not generally correspond with the HVAC zones. When a prox card passes into a new zone, it is detected and recorded. Most, but not all, areas are still open to staff members even if they forget their prox cards. People are somewhat careless with their prox cards, but some diligent staff members will go to the security desk and pick up a new prox card if their old one is mislaid. As part of the deal to entice GAStech to move into this new building, the builders included a free robotic mail delivery system. This robot, nicknamed Rosie, travels the halls periodically, moving between floors in a specially designed chute. Rosie is equipped with a mobile prox sensor, which identifies the prox cards in the areas she travels through.
Data Preparation
Prox Card Data
Both proxMobileOut-MC2.csv and proxOut-MC2.csv do not include any personal particulars of the employees including, Department and Office. These data were only available Employee_list.xlsx. Thus, the initiative is trying to combine the two csv files with Employee_list.xlsx respectively.
Creating unique identifier
Employee conducting the actions in both csv files may be identified by their unique prox-id, which is not available in Employee_list.xlsx. However, prox-ids follow the pattern of taking employees' first character of First Name followed by their Last Name. As such, I have created a new column in Employee list.xlsx: Name-ID.
On top of which, I have created another column in both csv files by concatenating first character of their Last Name with their First Name.
Combing datasets
Building upon which, I managed to combine the two csv files with Employee_list.xlsx by using Name-ID as the unique identifier.
Relating floor-zone to X,Y coordinate
Data provided in proxMobileOut.csv are in X,Y format while proxOut.csv are in floor & zone format. The inconsistent data format created inconvenience in relating data from one to another. Thus, I have decided to convert floor & zone data of proxOut.csv into X,Y coordinates.
- I noticed that each floor are having multiple zones. In order to avoid confusion as a result of duplication, I have created a new column: 'floor-zone' by concatenating floor and zone.
- After which, I cropped VAST_EnergyZone_Fx.jpg (x=1,2,3) images provided to showcase the map only. I imported proxOut.csv data into Tableau and set the background image to the cropped images respectively.
- Then, I approximated center points of each zone and key their respective X,Y coordinates into an excel sheet: 'floor-zone XY'. Meanwhile, it should be noted that floor 2 & 3 only have 7 and 6 zones respectively, which explains the rationale of not approximating all zones for each floor.
- In the end, I made use of excel's vlookup function to map each floor-zone to their respective X,Y coordinate.
Data Consolidation
Eventually, proxOut.csv and proxMobileOut.csv were consolidated into one csv file: "Prox Data.csv".
Approaches
Task 1
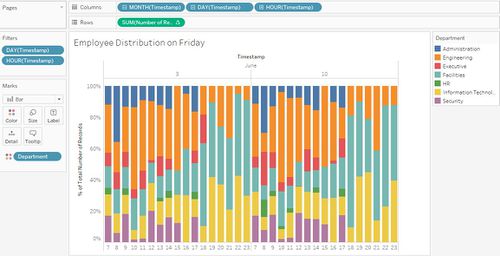
Charts demonstrated above are constructed by using Timestamp breakdown as Columns and Number of Records as Rows. Meanwhile, Timestamp - Day (3rd & 10th June) and Timestamp - Day (excluding 0 - 7 hrs whereby the office is empty) are used as filters for both charts. Department and Floor are used as Color respectively. Employee Distribution breakdown are fairly similar on 3rd a& 10th June.
- Employee Distribution on Friday by Departments
- Assuming that normal working hours end at around 18 hrs, departments like, Engineering, Facilities and Information Technology are usually working overtime.
- During normal working hours, HR and Executive take up smallest percentage of employees while Engineering, Facilities and Information Technology constitute the largest proportion of the workforce.
- Employee Distribution on Friday by Floors
- Assuming that normal working hours end at around 18 hrs, Floor 3 has no employees working overtime while the largest proportion gathers at Floor 2. With regards to the pattern identified just now, it is highly possible that departments like, Engineering, Facilities and Information Technology locates on Floor 2.
- During normal working hours, percentage of employees gathering on Floor 2 remain stable. On the contrary, Floor 1 & 3 employee percentage are fluctuating. Yet, it is worth noting that, their fluctuations are complementing one another (as Floor 1 percentage decreases, Floor 3 percentage increases). This indicates strong work relationship among employees working on Floor 1 & 3.
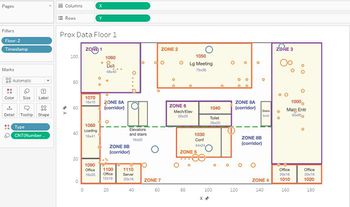
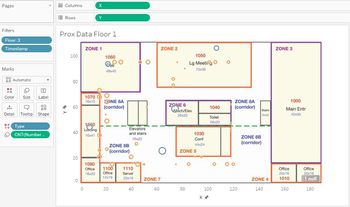
Charts demonstrated above are constructed by using X as Columns and Y as Rows. Type was used as color: fixed-prox and mobile-prox. Count(Number of Records) was used as size, showcasing number of employees in a certain region.
- Floor 1 data are mainly collected from fixed-prox sensors, gathering around Deli, Conf and Elevator. Largest percentage of mobile-prox data were around Zone 4, which are both offices in nature.
- Floor 2 data are quite evenly spread out. Other than, Deli and Conf, largest percentage of fixed-prox data were collected from areas like Meeting Room and corridor. Meanwhile, largest percentage of mobile-prox data were around Corridor and Main Entry area, indicating the high traffic on Floor 2.
- Floor 3 data are also evenly spread out. Fixed-prox data were collected from areas like, Elevator, Corridor and Loading. Meanwhile, mobile-prox data are concentrating around Corridor and Office area. With regards to overtime patterns identified earlier, most employees working on Floor 3 are from executive and HR department, which has a lot of traffic around office area.
Task 2
System Cooling Coil Power vs. System Heating Coil Power
On both Fridays (3rd & 10th June), System Cooling Coil Power is fluctuating throughout the day while System Heating Coil Power remain stable around 0. The pattern may be attributed to the fact that in June (summer), aircons are mainly used for cooling purposes.
Thermostat Cooling Setpoint vs. Thermostat Heating Setpoint
On both Fridays (3rd & 10th June), fluctuation in Thermostat Cooling Setpoint complements that of Thermostat Heating Setpoint. This may be out of consideration to maintain stable temperature in the building.
Deli Fan Power
Average Deli Fan Power keep on fluctuating throughout the day. Its lowest periods are 6-7 AM and 5-9 PM. Stable power usage from 7 AM to 5 PM may be attributed to Deli's normal operating needs. Relatively high power usage before 6 AM and after 9 PM may be explained by the need of keep products fresh.
Task 3
Hazium Concentration
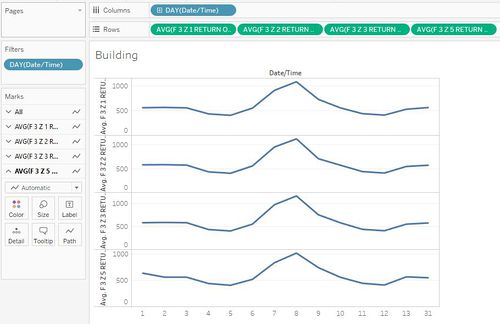
Hazium concentration started increasing at all level from 2nd June onwards and peaked in between 9th and 12th June. On top of which, average hazium concentration is highest on Floor 3 Zone 1 and Floor 2 Zone 4.
Supply Inlet Mass Flow Rate vs. Supply Inlet Temperature
Throughout most time of the day, Supply Inlet Temperature remain independent from the fluctuation of Supply Inlet Mass Flow Rate. However, on both Fridays, Supply Inlet Temperature began to fluctuate after 21 hrs indicating potential undesirable Supply Inlet behavior.
Task 4
Number of Employees vs. Hazium Concentration by days on Floor 3
As demonstrated in the treemap above, other than weekends like, 5th, 11th and 12th June, number of employees on Floor 3 remain high. Meanwhile, Hazium concentration in Floor 3 Zone 1 is highest on 9th June, which was a workday in nature. This should alert the employees to take preventive measures especially Floor 3 Zone 1 is the Deli area with heavy traffic.
Number of Employees vs. CO2 Concentration by days on Floor 3
As mentioned earlier, employee distribution on Floor 3 throughout the period is lowest on 5th, 11th and 12th June (weekends). Meanwhile, CO2 concentration in Floor 3 Zone 1, 2, 3, 5 are lowest on the same days as well. This indicates that CO2 concentration has positive correlations with the number of employees in the office.
Tools Utilized
- Tableau
- Microsoft Excel
- JMP Pro 12


