IS428 2016-17 Term1 Assign3 Liang Bing
Contents
Data Exploration & Data Manipulation
The Employee List.xlsx data file does not provide enough insights by itself. Since the prox data detected by the sensors were collected from these employee's card, it makes more sense to combine employees' information with the prox sensor data so they together provide more information.
To integrate the Employee List.xlsx file and the other two sensor data files, I used Microsoft Excel.
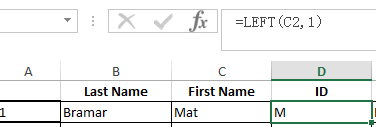
The prox ID contains the employees' names and a 3 digits number starts with "00". I created a new column in Employee List.xlsx to store the employees' prox ID without the 3 digits number, this is done by combining the first letter of the employees' last name and the employee's first name.
For the prox data table, I trim the employee Id out from their prox card id.

After that, I used "VlookUp" formula to look for the employee Id from the employee List.xlsx in order to pair up employees' record and the employees' respective office and their department. For example, the employee whose employee ID is vawelon is in office 1070 and is belongs to the facilities department.


I have also created one more field to extract the floor which the employees' office located.

The above data integration steps are repeated for Mobile readers' data set as well.
Moreover, the data collected from mobile robots and the data collected from fixed prox card readers have different ways to express their locations. i.e. the mobile robots use the coordinate (x,y) for their location when a reading was recorded, while the fixed reader use the zone for their location. This made it inconvenient to combine the mobile readers' data and the fixed readers' data for a overall visualization of the employees' activities. Therefore, it is either the fixed readers should have the x,y data or the mobile readers should have the zone it is located in order to ensure the 2 set of data being matched.
I chose to assign (x,y) coordinates to the fixed readers data. the idea is to assign one (x,y) value to one zone at that particular floor. I used Microsoft Excel for the data manipulation.
In the fixed reader data, there is a zone in at floor 3 being indicated as "server room", to standardize it with the other zones (which are recorded in numerical form), the server room is given a number 10. This is done using Excel.

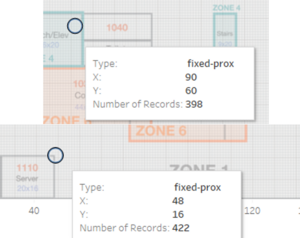
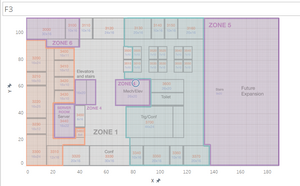
To create the x and y field, I use the Calculated Field in Tableau Desk 10.0 which allows me to put conditions to define the x and y coordinates for a point. I have calculated the x and y coordinate for each zone at each floor, for example, the x,y coordinates for Zone 1 at Floor 1 is (52, 15) according to the Proximity Zones Map provided.
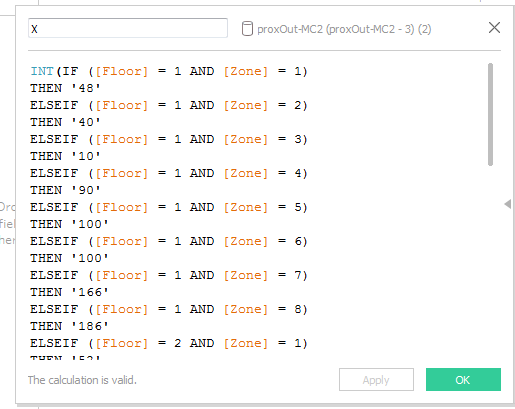
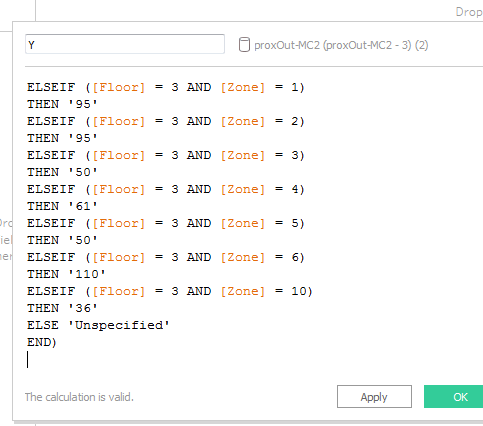
The resulted data set with newly added x and y field is then exported as csv for the data integration with Mobile readers' data.
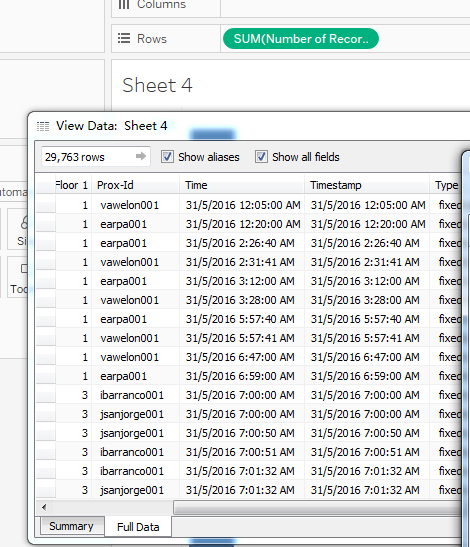
At the end of the data cleansing, manipulation and integration, the data fields left are as follow:
![]()
Task 1
What are the typical patterns in the prox card data? What does a typical day look like for GAStech employees?
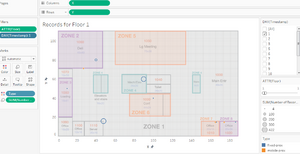
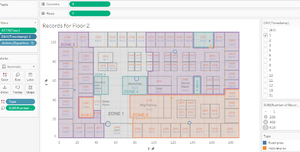
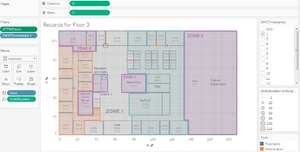
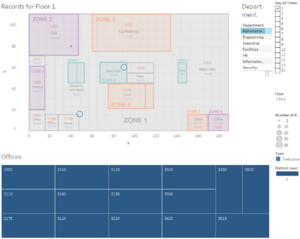
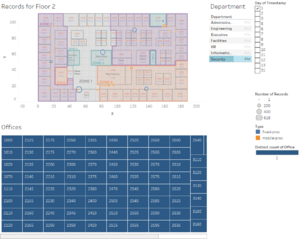
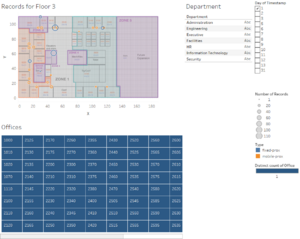
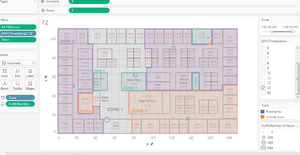
Using Tableau to indicate the mobile and fixed readers' records for each floor, and use the time stamp as filter for picking the data for one day, it is very easy to see the distribution of employees' prox card readings in 3 floors in one day. In the following 3 graphs, the blue color circles indicates the fixed reader records while the orange color circles indicates the mobile reader records. The size of the circles indicates the number of records.
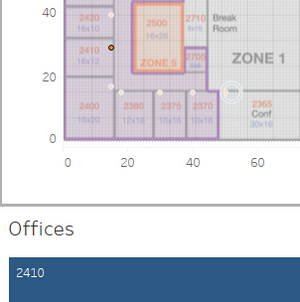
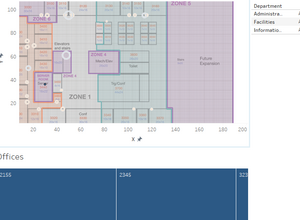
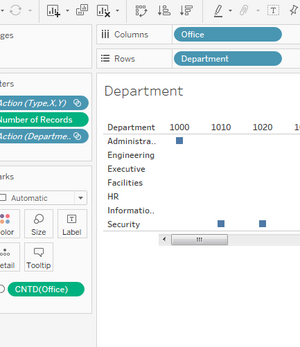
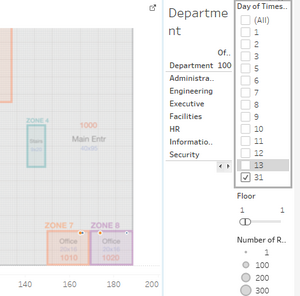
However, these illustrations are not enough to tell information about what kind of GAStech employees contributed to these records and therefore have limited information about these employees' activities in the company. Therefore, I use tree map to show the offices of the employees and a table to show the emplpyees' departments. Furthermore, I construct 3 similar dashboards for the 3 floors which can dynamically illustrate what kind of employees are there for each circle.
With the dynamic dashboards, the following patterns are found:
- Among all the zones in each floor, Zone 1 and Zone 4 has the most amount of people. Zone 1 is the common area while Zone 4 is the elevator which employees have to use daily.
- The mobile reader records in front of most the offices indicates that most of the employees work in their respective offices for the whole day
- And for some common rooms or rooms for special uses such as the meeting room or server room, there will be employees from various departments like IT, Admin or facilities and they are from various offices
Task 2
Describe up to ten of the most interesting patterns that appear in the building data. Describe what is notable about the pattern and explain its possible significance.
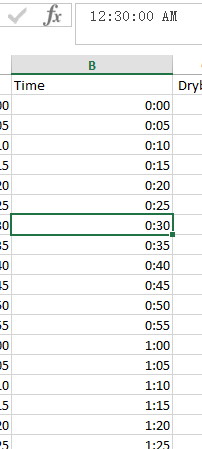
The data used for this section is the bldg-MC2.csv. I have created a new calculated field to store the time value without the date using Excel. By having this time field, it will be easier to show the sensors data throughout one day by placing the time attribute at the rows shelf.
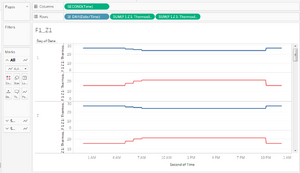
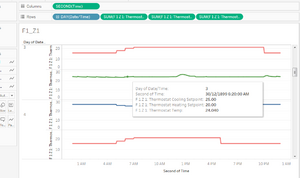
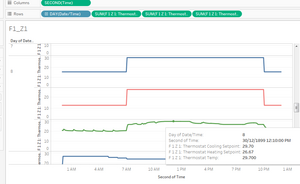
- The thermostat cooling setpoint and the thermostat heating setpoint has inversed relationship, when the thermostat cooling setpoint increases, the thermostat heating setpoint is decreased. This could be a measure to keep the thermostat temperature at a constant comfortable level which is around 24.
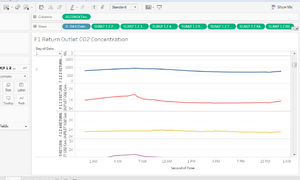
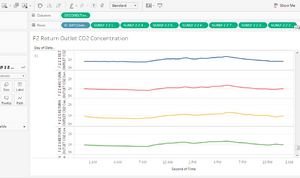
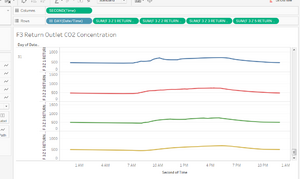
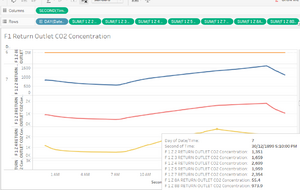
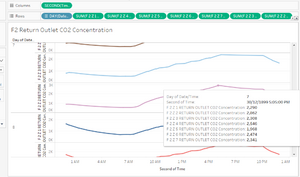
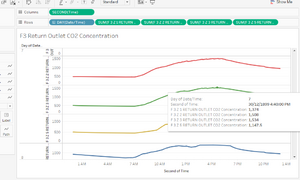
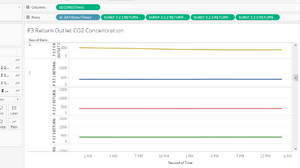
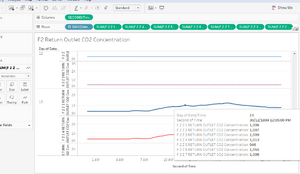
- The Return Outlet CO2 Concentration for most of the zones in floor 1, 2 and 3 are having similar pattern. This could mean that the ventilation at these zones are efficient in keeping the air float so as to maintain the CO2 level.
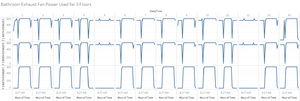
- The power used by the exhaust fan for each floor have shown relatively similar pattern compare to each other. For each floor, the power consumed may vary for different days. For example, the power consumed by the bathroom exhaust fan at floor 3 is 0 for public holidays. However, they all exist the pattern of a constant power consumption during the office hours (7am - 9pm).
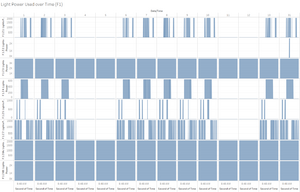
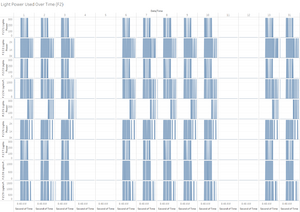
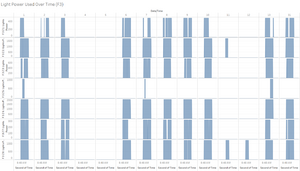
- The power used by the lights are comparatively constant for all days, except for some zones will have zero power used for lighting during public holidays. Some zones or offices will keep their lights open every day.
Task 3
Describe up to ten notable anomalies or unusual events you see in the data. Prioritize those issues that are most likely to represent a danger or a serious issue for building operations.
- The thermostat cooling and heating setpoint for 7 June and 8 June are abnormally high. And the setpoint was no longer inversely related, but increased together. And this has resulted in higher thermostat temperature than normal times.
- The Return Outlet CO2 Concentration for 7 June and 8 June are abnormally high for most of the zones at 3 floors. For some zones, the co2 concentration exceeded 2500 ppm. Such condition is considered as having poor air for working environment. It might cause headache, sleepiness and even slight nausea.
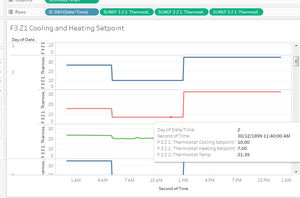
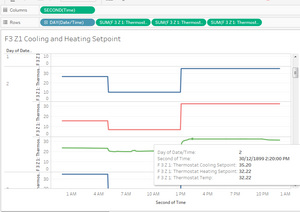
- The thermostat cooling and heating setpoint for F3_Z1 is having abnormal readings from 2 June to 13 June. Not only the cooling and heating setpoint's abnormal fluctuation from 10 to 30+ is the concern, but also the thermostat temperature for the zone which heated up to 32 after 1pm. Most of the executives and admin staff are working at that area, the heat might decrease their efficiency of work due to humid environment or even heatstroke.
Task 4
Describe up to five observed relationships between the proximity card data and building data elements. If you find a causal relationship (for example, a building event or condition leading to personnel behavior changes or personnel activity leading to building operations changes), describe your discovered cause and effect, the evidence you found to support it, and your level of confidence in your assessment of the relationship.
- When there is a weekend/public holiday like 5 June and 11 June, there is almost no employees in the company. During these days, the Return Outlet CO2 Concentration in the company is flat and low. In contrast, the Return Outlet CO2 Concentration level during the normal working days are usually higher than that on the 5 June and 11 June. Also, the concentration level during working days will be higher during 7am - 7pm which is the working hours. Therefore, this implicates that the CO2 concentration level in the normal case is changing with the amount of employees at that zone.
- From the power consumed by lights over time at floor one graph, it can be seen that the lights for office 1020 at Zone 8 is always consuming power, that is to say, the lights at office 1020 is always on. From the Prox data, this office is for security employees. This is also the security office which faces the main entrance. Therefore, it is reasonable to say that this office needs its lights on for all times so as to facilitate the security guards' work. However, the employees activity graph showed that the security guards do not have their readings at the office 1020 during public holidays. There is not enough information to show that the security employees are still coming back to the company during public holidays. Therefore, the level of confidence in this set of assessment is higher than 50% but not less than 90%.
Tools Used
- Microsoft Excel
- Tableau
- JMP PRO
References
- How to export Tableau data to excel/csv file: https://community.tableau.com/docs/DOC-6172
- To create a new calculated field for time in excel: http://excelsemipro.com/2012/10/extract-time-from-a-date-time-number-in-excel/
- What are safe levels of CO and CO2 in room: https://www.kane.co.uk/knowledge-centre/what-are-safe-levels-of-co-and-co2-in-rooms
