IS428 2016-17 Term1 Assign3 Cornelia Tisandinia Larasati
Contents
Overview
In this assignment, we seek to help GAStech to understand its operations data by using two weeks of building and prox sensors data. The objectives of this assignment are as follows:
1. What are the typical patterns in the prox card data? What does a typical day look like for GAStech employees?
2. Describe up to ten of the most interesting patterns that appear in the building data. Describe what is notable about the pattern and explain its possible significance.
3. Describe up to ten notable anomalies or unusual events you see in the data. Prioritize those issues that are most likely to represent a danger or a serious issue for building operations.
4. Describe up to five observed relationships between the proximity card data and building data elements. If you find a causal relationship (for example, a building event or condition leading to personnel behavior changes or personnel activity leading to building operations changes), describe your discovered cause and effect, the evidence you found to support it, and your level of confidence in your assessment of the relationship.
Data Preparation
| Prox Card Data | Explanation |
|---|---|
| The prox-ID is made up of the first letter of the first name of the employee, the last name of the employee and the number of times they had to pick up a new card. Hence, a new “EmployeeID” column was made from the Employee List data file. The departments were then assigned to the EmployeeID. | |
| The data from the fixed prox card readers were also assigned (x,y) values according to the zone they are located in. This is done by estimating the (x,y) values of the centre of the zones in each floor. This was then added to the mobile-prox data set that is recorded by Rosie. | |
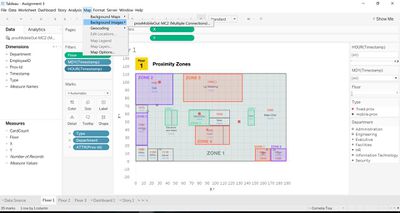
| The prox zone map was uploaded into Tableau as a map and adjusted to ensure that the position of the map relative to the data points was correct. |
1. Typical Patterns in the Prox Card Data
1.
2. Interesting Patterns that Appear in the Building Data
| Pattern | Explanation |
|---|---|
| Example | 1.XXX XXX |
| Example | 2.XXX XXX |
| Example | 3.XXX XXX |
| Example | 4.XXX XXX |
| Example | 5.XXX XXX |
| Example | 6.XXX XXX |
| Example | 7.XXX XXX |
| Example | 8.XXX XXX |
| Example | 9.XXX XXX |
| Example | 10.XXX XXX |
3. Anomalies or Unusual Events Observed in the Data
| Anomaly | Explanation |
|---|---|
| Example | 1.XXX XXX |
| Example | 2.XXX XXX |
| Example | 3.XXX XXX |
| Example | 4.XXX XXX |
| Example | 5.XXX XXX |
| Example | 6.XXX XXX |
| Example | 7.XXX XXX |
| Example | 8.XXX XXX |
| Example | 9.XXX XXX |
| Example | 10.XXX XXX |
4. Observed Relationships Between Proximity Card Data and Building Data Elements
| Relationship | Explanation |
|---|---|
| 1.XXX XXX |
Cause:XXX Effect:XXX |
| 2.XXX XXX |
Cause:XXX
Effect:XXX |
| 3.XXX XXX |
Cause:XXX
Effect:XXX |
| 4.XXX XXX |
Cause:XXX
Effect:XXX |
| 5.XXX XXX |
Cause:XXX
Effect:XXX |


