IS428 2016-17 Term1 Assign2 Lim Lai Ho
Contents
Theme
This assignment aims to find the relationship between the victim’s age and the causing factor, at which age group is the common when accidents occurred and what are the causes for the accidents. From these findings, I aim to offer some recommendations/measurements to reduce the amount of accidents occurred within the age group found.
Attributes Used
- Major Industry Type
- Nature of Injury
- Major Injury Indicator
- Victim’s Age
- Cause
Step by Step
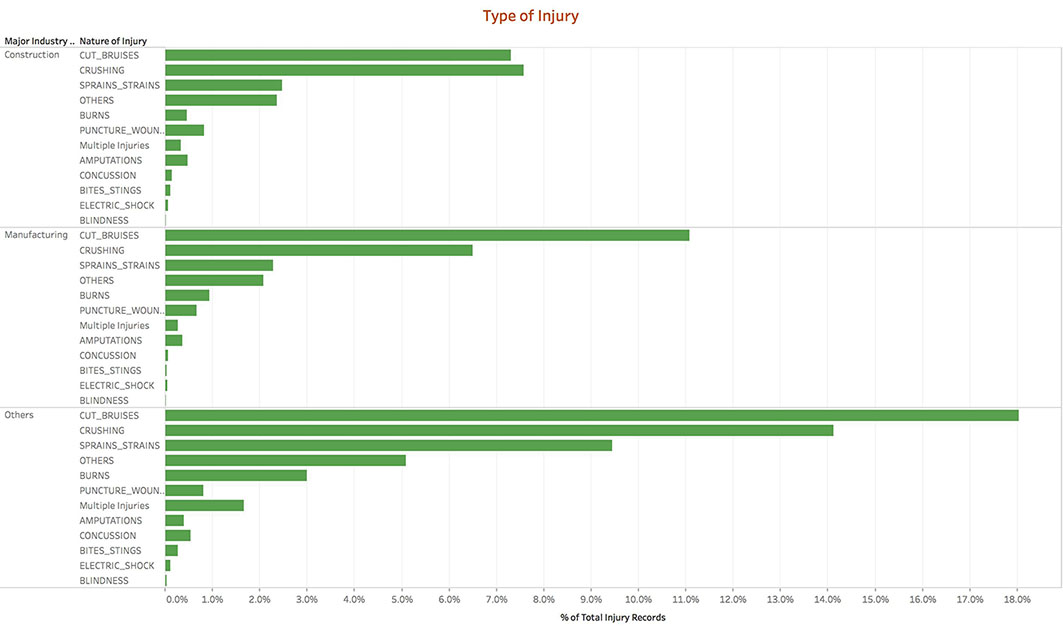
To begin with, I have examined the data from the raw file to filter out which one the related attributes that I would need. The type of Major Industry seems to be the appropriate attribute for me to explore first as it would help me to find out which industry has the most accidents. Also, I have added more attribute, the Nature of Injury into the same bar graph so that I would know what are the amount of different injury within each industry.
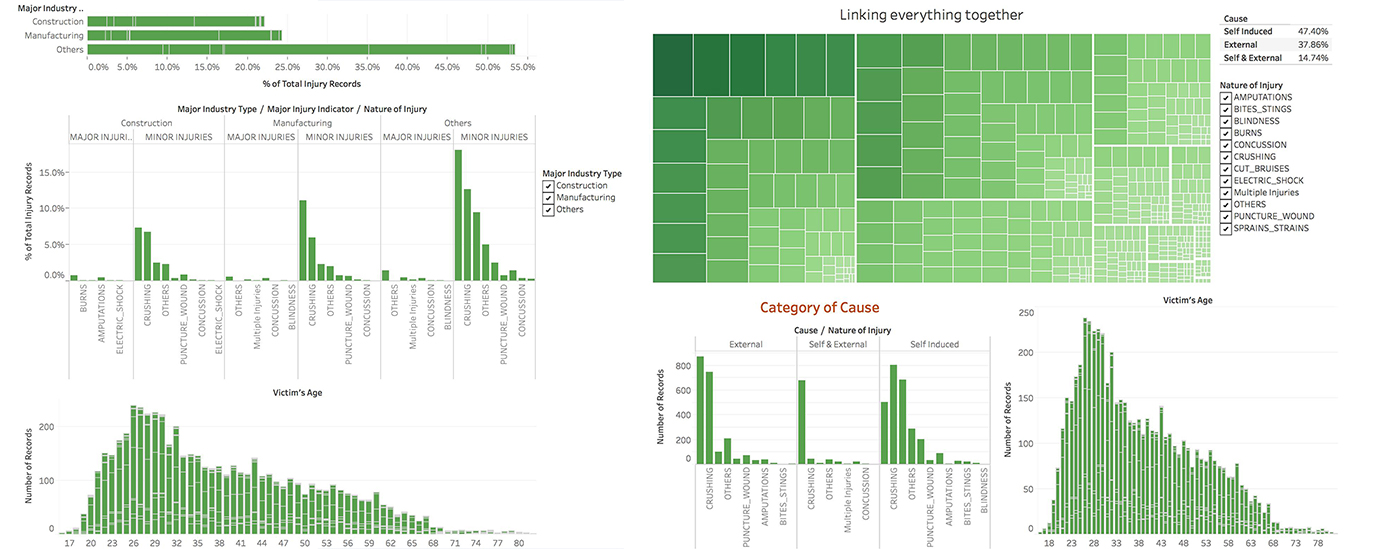
This bar graph depicts that ‘Others’ industry has half the total amount of Injury recorded and Construction and Manufacturing each have half of the ‘Others’ industry. The ‘Others’ industry has the most number of injury records.
This graph further breakdown each industry into the nature of injury. From this graph, I could clearly see that the top three injuries are ‘cut bruises’, ‘crushing’ and ‘sprain strains’ in all industries.
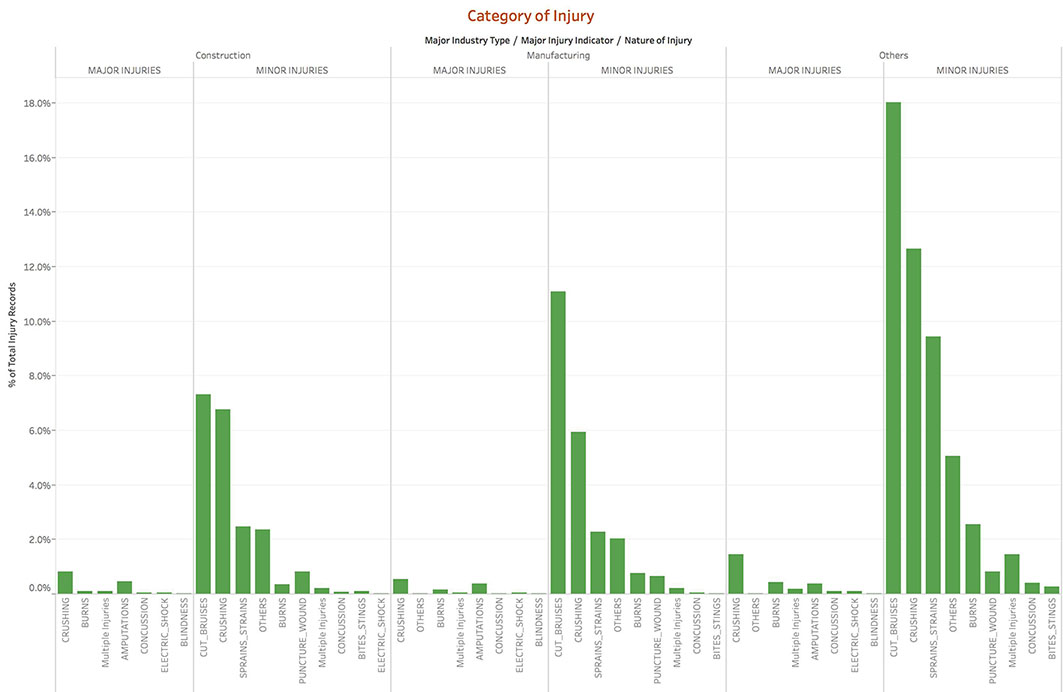
To further explore how serious these injuries could be, I decided to plot the following graph.
This graph categorises the seriousness of each injury into major and minor. From the graph, the top three injuries that I have listed previous, only ‘crushing’ falls under major injury while ‘cut bruises’ and ‘sprain strains’ are minor injuries. It also shows that there are more minor injuries than major injuries occurred across all industries.
Now that I have find out the amount the different injuries and the seriousness of the injuries occurred in each industry, my next step is to explore more on the information of the victims.
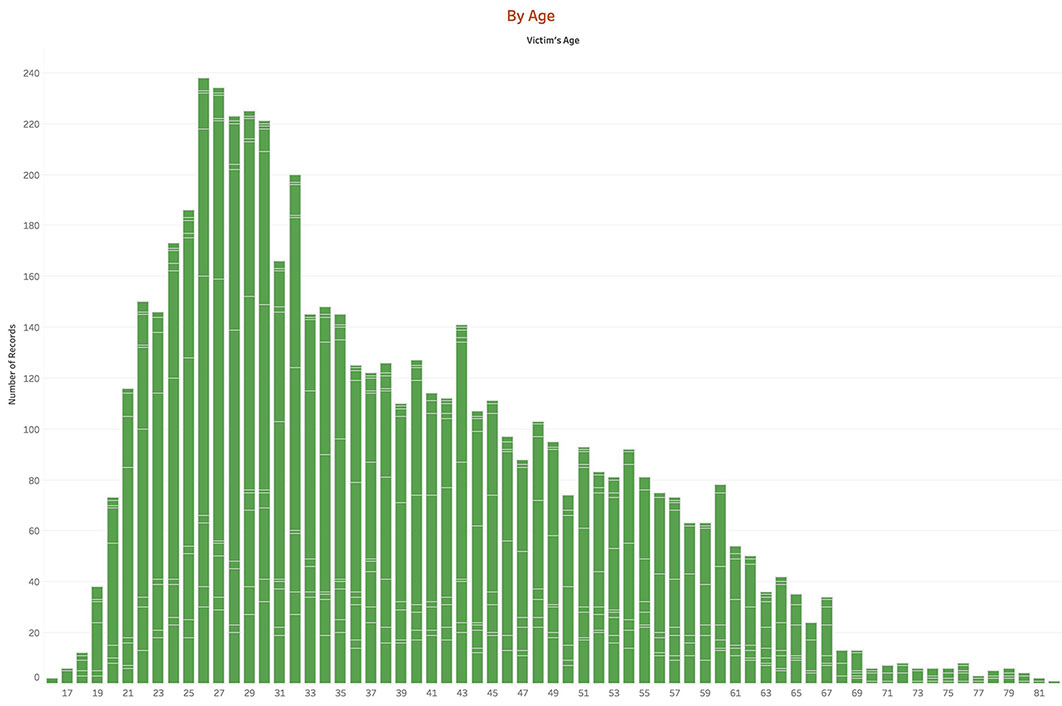
I realised the I find of more from the victim by looking at their age which the raw data has provided.
From this graph, I could clearly see that there is a distribution in the injury records ranging from aged 17 to 81 and majority of the victims are from 19 to 67 years old. However, I would say that 25 to 32 age group is the biggest.
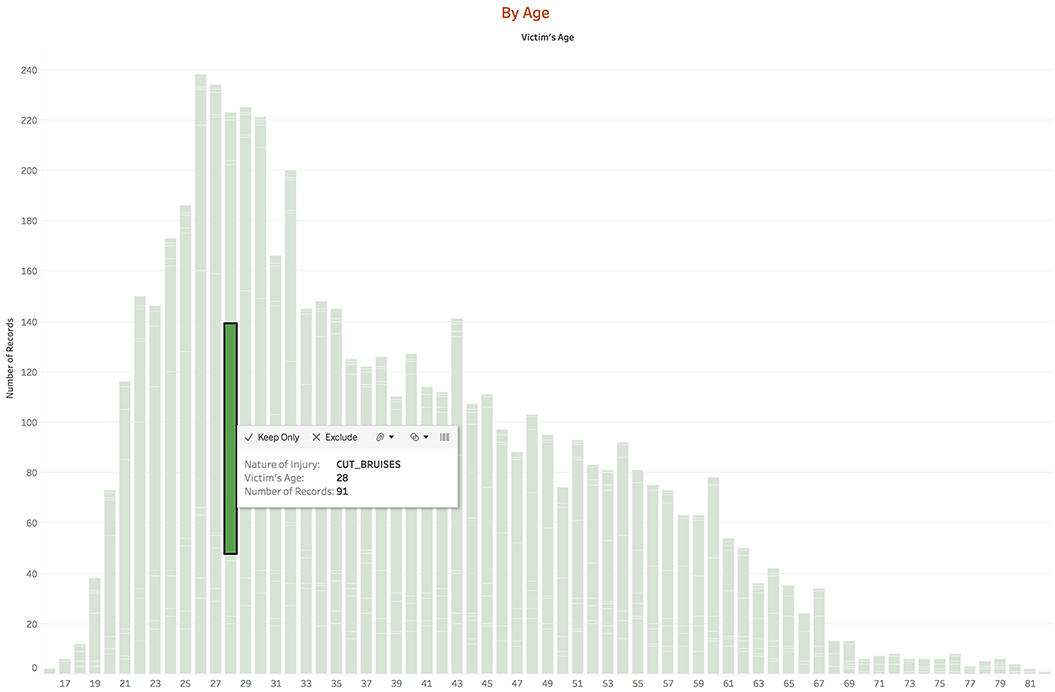
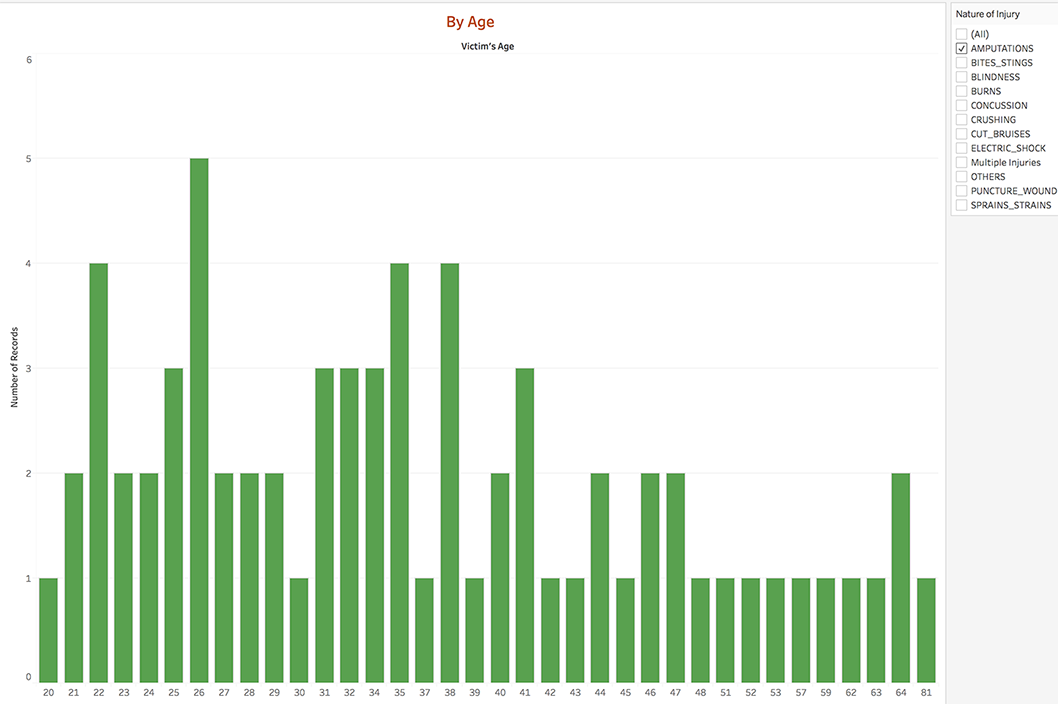
I have also marked the graph with the nature of injury so that I could filter them by the victim age based on the type of injury (Filter shown on the next graph)
Now that I have found out the most common age group, I need to further explore the cause of the injury. This would allow me to understand how the injury came about from all the data I have.
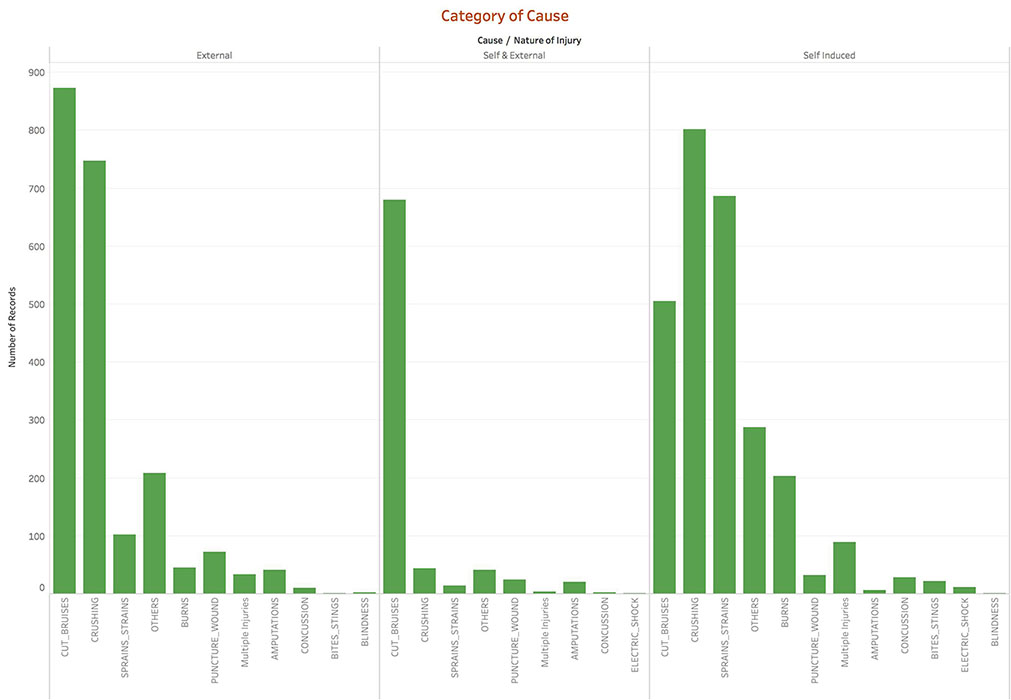
From the graph, it shows that half of the injuries are by self-induced while injuries caused by external factor is about 38% of the records and self and external factor is about 15%.
This graph further divides the type of injury into the respective cause. From the graph, self-induced injury is mainly caused by crushing while ‘cut-bruises’ holds the majority in the external and both self and external factors.
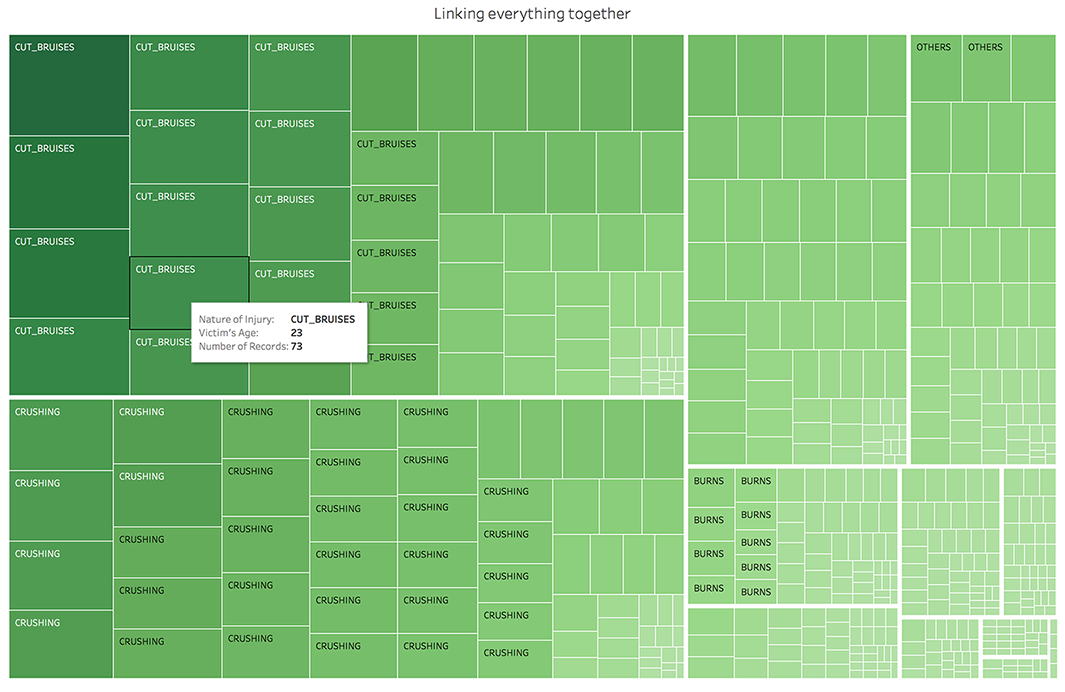
The last graph I built is a Treemap. It will segment each type of injury and display the number of records based on the age and nature of injury. This would allow me to see the relationship between the nature of injury and the victim.
Linking Everything Together
I have constructed the final visualization based on all the graphs that I have plotted. By linking all the graphs together would help me to visualise clearly on the finding based on the question that I have posted.
My findings:
- The construction and manufacturing industry are not the majority for the injury records.
- There are more minor injuries than major injuries.
- Age group between 25 to 32 is the biggest group among all.
- The most common injuries are ‘cut bruises’, ‘crushing’ and ‘sprain sustain’.
- Half of the injuries are caused by self-induced.
Conclusion
Based on my general knowledge, I would think that the construction industry would contribute the highest injuries among all. However, my finding has proven that more safety measures has to be carried out in other industries except for the construction and manufacturing. Although based on my findings, the injury sustained were minor in majority, I do believe that young generation has to be more careful during work as compare to the older generation which has leads to the high injury rate at the age group of 25 to 32. Individual has to be more responsible of their life and be more aware in their working environment.
The final visualization can be accessed via this URL: https://public.tableau.com/shared/NHK2X3SX8?:display_count=yes
Tool Utilised
The tools used for this assignment.
- Tableau
- Microsoft Excel

