IS428 2016-17 Term1 Assign2 Lim Hui Ting
Contents
Theme of Interest
1.Background
Recently, the issue of insufficient medical leave given to injured workers has come under the spotlight again. In May this year, the court has suspended Raffles Hospital orthopaedic surgeon Wong Him Choon, 51, for six months. He had operated on a construction worker’s broken hand, but gave him just two days' medical leave and certified him fit for light duties for a month after that (Ho, 2016).
In August this year, the straits times reported that a shipyard worker has to had his right index finger amputated after it was crushed by some falling metal. However, he was only given one day of medical leave and three months of light duties (Ho, 2016).
Insufficient medical leave given to injured workers is a widespread problem in the construction industry. Employers usually influence doctors to give injured workers shorter medical leave in order to avoid reporting the accident to the Ministry of Manpower(MOM). Employers can also maintain their clean safety record and avoid paying higher insurance premiums in the future. (Foo, 2016)
Since injured employees are entitled to sufficient medical leave on proper clinical grounds, this assignment aims to analyse the distribution of the duration of the medical leave given to injured employees not just in the construction industry but the other industries in Singapore.
2. Questions for Investigation:
1)When do the accidents usually occur?
2)What are the victims’ characteristics?
3)What is the distribution of the number of MC days given to injured employees?
Tools Utilised
1.JMP Pro
2.Tableau
Data Preparation
1. Irrelevant Columns Removed
| Columns Removed | Reasons |
|---|---|
|
Analysis is not part of the objective of this assignment |
|
Not required as the same information can be taken from other columns |
|
Information is not useful as they are numerical representations of the descriptions set by MoM |
2. Reformat All Text Columns
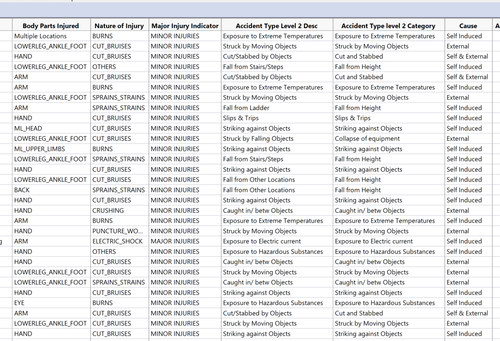
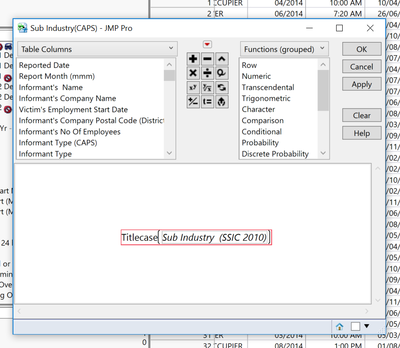
From the raw data, we can see that some columns are in uppercase whereas some columns are in lowercase. Furthermore, as for the Occupation column, some rows are in uppercase,lowercase or titlecase. Thus, it is better to standardise all the text columns to titlecase in order for a neater presentation of findings. This is done by using the Titlecase function in the column’s formula in JMP.
3. Removal of Underscores in Text Columns
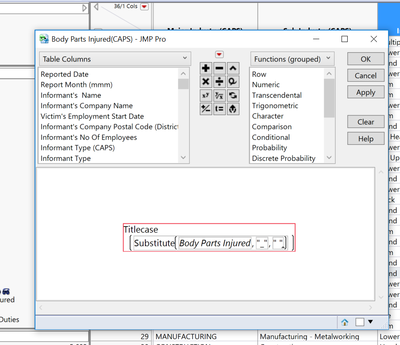
From the nature of injury column and body parts injured column, underscores are being used. In order for a neater presentation of findings, these underscores are removed using the substitute function in the column’s formula.
4. Recode Occupation Column
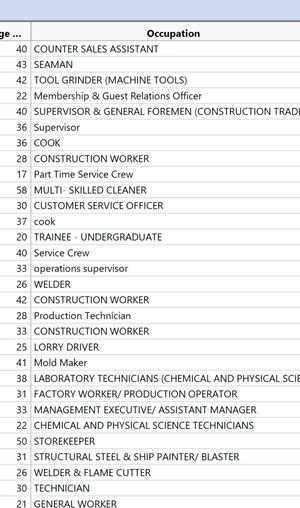
For the Occupation column, some occupations relate to the same thing but are being recognised as different occupation due to spelling errors, spacing and singular/plural forms. Thus, these are being corrected using the recode function in JMP. For example as seen in the screenshot above, construction worker is being spelt differently such as “construction wokrer” or “constrction worker”. “Cook” and “Cooks” refer to the same occupation just that one is in singular form and another is in plural form.
5. Removal of Missing Records
Using the Missing Data Pattern function in JMP, there are a total of 47 rows with missing values in certain columns. As the numbers are not significant, I have deleted these rows instead of imputing a value for them.
6. Reformat Time Column to a Format Readable by Tableau
When the clean dataset is being imported in Tableau, Tableau recognise the Accident Time column as a character column instead of time format. Attempts to change the format directly from Tableau did not work. Thus, a calculated field is being created to change the format of this column and to change the timing format from 12-hour to 24-hour timing. The formula being used is as follows:
IF RIGHT([Accident Time],2)="PM" AND NOT LEFT([Accident Time],2)="12" THEN MAKETIME(INT(LEFT([Accident Time],FIND([Accident Time],":",1)-1))+INT(12),INT(MID([Accident Time],FIND([Accident Time],":",1)+1,2)),INT(00)) ELSEIF RIGHT([Accident Time],2)="AM" AND LEFT([Accident Time],2)="12" THEN MAKETIME(INT(0),INT(MID([Accident Time],FIND([Accident Time],":",1)+1,2)),INT(00)) ELSE MAKETIME(INT(LEFT([Accident Time],FIND([Accident Time],":",1)-1)),INT(MID([Accident Time],FIND([Accident Time],":",1)+1,2)),INT(00)) END
When do the Accidents Usually Occur?
Overview of Workplace Injuries in 2014
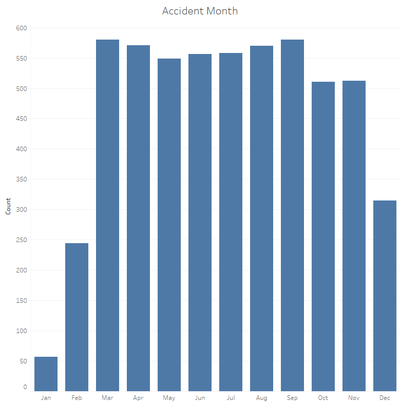
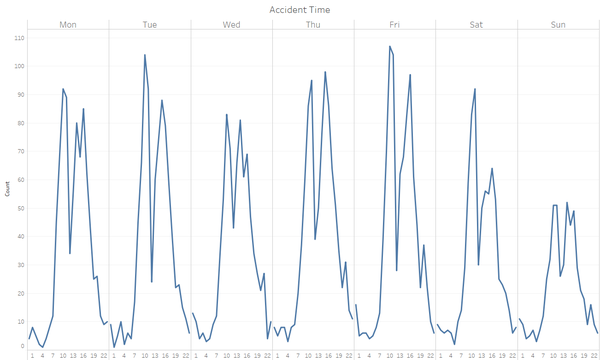
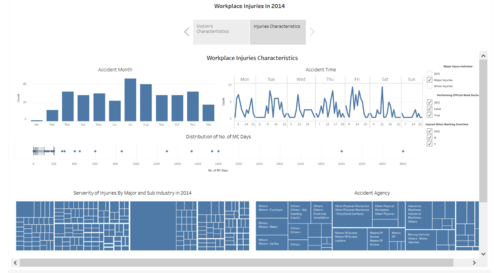
In 2014, January has the least number of injured workers. The number of injured workers between March to September is relatively the same and dips between November and December. The number of injured workers are relatively the same between Monday to Saturday. Sunday has the least number of injured workers. Monday, Wednesday and Sunday have three peaks on the graph whereas Tuesday, Thursday Friday and Saturday has two peaks on the graph. Employees tend to be injured between 10-11am and 2-4pm.
What are the Victims' Characteristics?
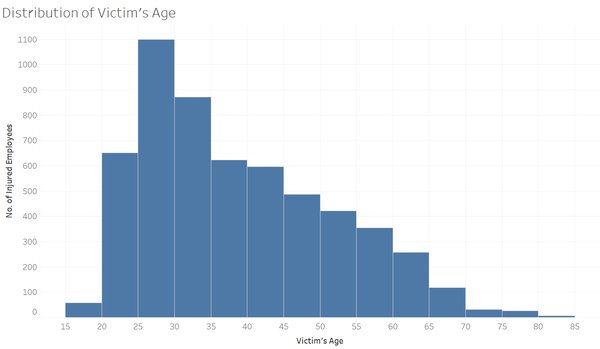
1 Employees' Age
From the histogram, most of the victims are between 25-30 years old.
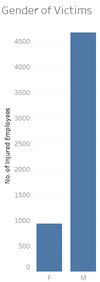
2 Employees' Gender
From the bar chart, there are more male employees injured than female employees in 2014.
3 Employment Tenure
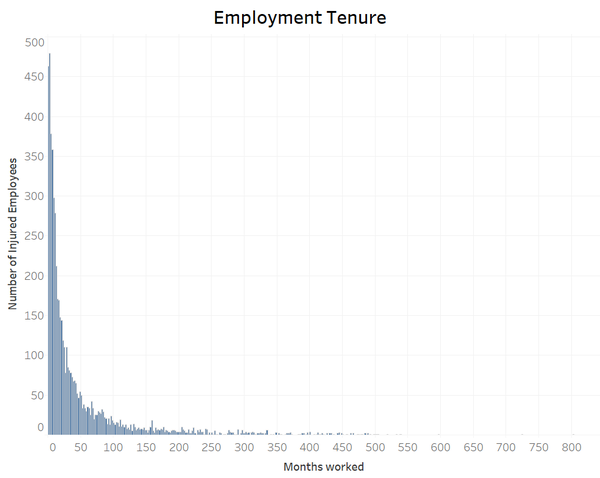
From the histogram, where the number of bins are set at two months, we can see that most of the injured employees are new comers who have worked at the company for less than 6 months. Thus, this means that less experience employees have a higher tendency to be injured at the workplace.
4 Percentage of Manual Work
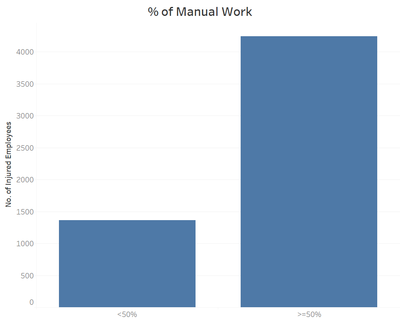
The bar chart above that shows that jobs that requires more manual work has more injured employees.
5 Type of Industry and Occupation
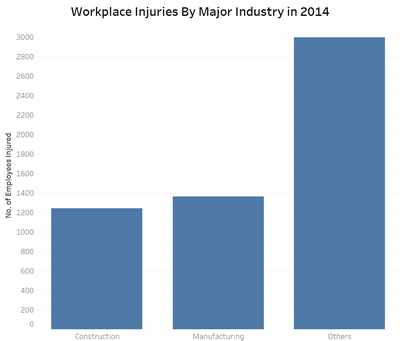
From the bar graph, it seems like others industry has the most no. of employees injured. However, this graph can be misleading as the others industry are made up of many industries which could be a possible reason why it has the highest no. of employees injured.
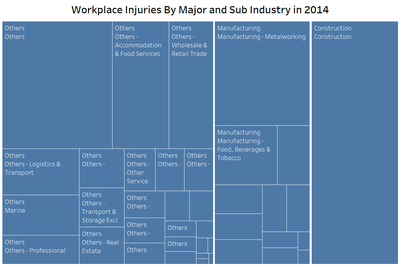
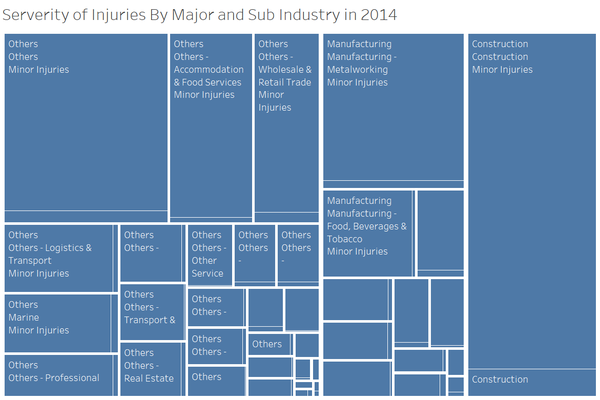
By further subdividing the major industry into sub industry, we are able to see that construction industry has the most number of accidents followed by the others industry and metalworking industry.
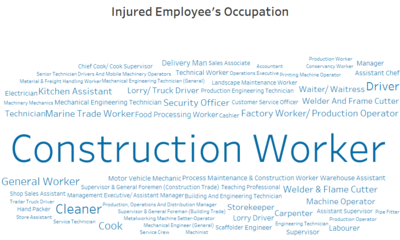
As there are many types of occupations available, those occupations that have less than 10 injured employees are being filtered out from the Word Cloud. As such, we can see that Construction Worker is the most hazardous occupation as it has the highest number of injured workers followed by Cleaner and Driver.
6 Type of Company
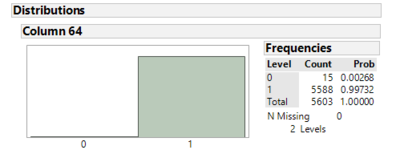
As only the number of employees of the informants are given, we need to find out if the informant’s company is usually the same as the employer’s company. By using if-else where 1 indicates that informant company is the same as the employer company and 0 indicates that they are not the same. From the barchart, most of the Informant company is the same as the employer company. Thus, the no. of employees in the informant company will be used as an estimation of the size of the employer company.
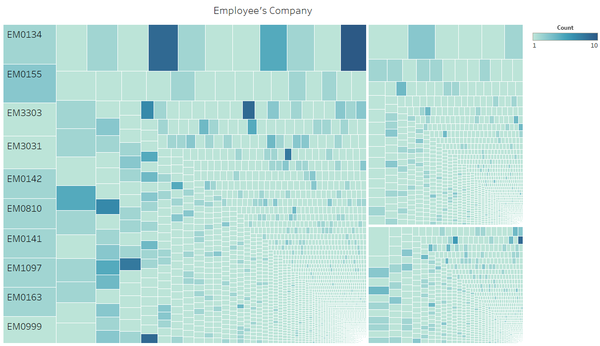
Using the number of informant’s employee as the size of the treemap and the number of injured workers as the colour intensity, a treemap is created as shown below.
From the treemap, it seems that for construction industry, the companies that are smaller in size tend to have more injured employees whereas the relationship between company size and the number of injured employees are not that clear for manufacturing and others industry. For the others industry, company EM0205 has 10 injured workers in 2014. For manufacturing industry, EM1412 has 4 injured workers in 2014. For the construction industry, EM0187 has 9 injured workers in 2014.
7 Severity of Injuries
From the treemap, the size of the rectangle represents the number of injured employees. Construction industry has the most number of injured employees. The construction industry also has the most number of major injuries as compared to the other industries.
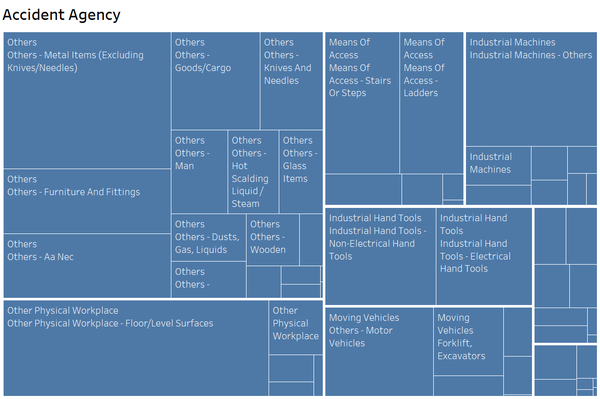
8 Agency Type
The most common agent of the accident is the floor and other metal items.
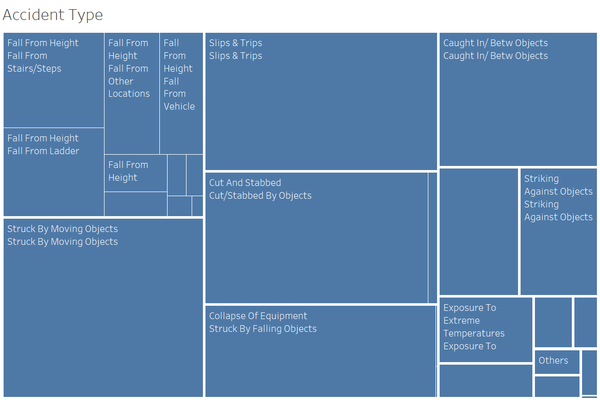
9 Accidents Type
The most common accident type is struck by moving objects and slips & trips.
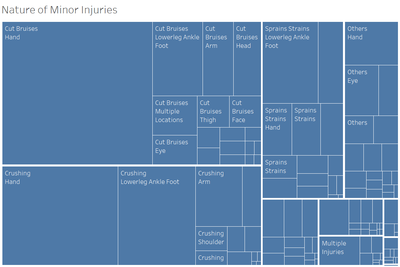
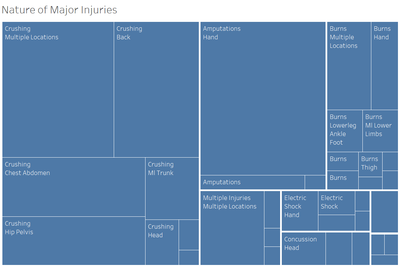
10 Injuries Type
For minor injuries, the most common injuries sustained by the employees are cuts and bruises on the hand and crushing of the hand or lowerleg ankle foot. For major injuries, the most common injuries sustained by the employees are amputations of the hand and crushing of various body parts.
What is the Distribution of the Number of MC Days Given to Injured Employees?
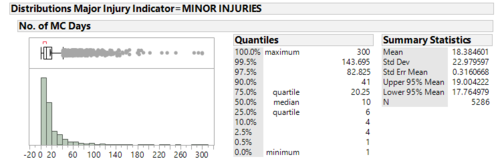
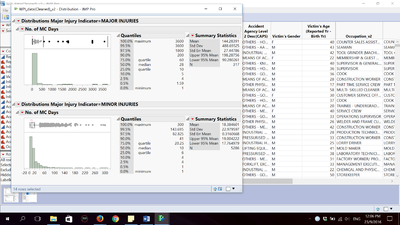
From the distribution analysis above, the median number of MC days given to employees who suffered minor injuries is 10 days whereas the median number of MC days given to major injuries is 28 days. This is deemed as reasonable as typically employees who suffered from major injuries should be given more MC days than employees who suffered minor injuries as they need more time to recover.
However, from the major injuries distribution, the maximum number of MC days given to the employee is 3,600 days which is equivalent to about 10 years. It is highly impossible for this to happen in the corporate world as it is not commercially wise to do so. This means that it is very likely that the injury has caused the employee to lose his ability to work. Another possibility is that there are no field that allows the informant to indicate if the injured employee is still an employee of the company or has been laid off due to his injury. Thus, the informant might key in a very large number for MC days to indicate that the injured worker is no longer an employee of the company.
A further look into the outliers of the number of MC days given to employees who sustained major injuries suffered amputations or blindness. This means that it is very likely that the employee has lost his ability to work which further proves my earlier explanation that the informant might randomly key in a large number for the number of MC days given as the employee is no longer part of the company. MoM or the relevant authorities might want to look into these cases to see if the employees are given proper compensation and due care after being laid off from the company due to his inability to carry out his duties.
Another observation to note is the minimum number of MC days given to employees who suffered from major injuries. From the distribution chart above, we can see that the minimum number of days of MC given is only 1 day which is the same as the employees who suffered from minor injuries.
Using data filter function in JMP, further analysis will be done on the employees who suffered major injuries and are given less than 3 days of MC. There is a total of 4 records found. All of the victims are hospitalised for at least 24 hours.For the victim who was only given 1 day of MC, he suffered from electric shock and was hospitalised for at least 24 hours. This might be a one off incident as there is only 1 record out of the whole dataset. However, we cannot ignore the fact that there are unreported cases of victims who suffered from major injuries but are not given the reasonable number of days of MC. This will not be found in the dataset.
Thus, relevant authorities might want to have made amendments to the current policies,such as having a minimum number of MC days for victims who sustained major injuries, to provide more protection to victims especially those who work at the hazardous industry such as the construction industry
Final Deliverables
The final deliverable is a tableau story board that consists of two dashboards. One of the dashboards describe the characteristics of the victims whereas the other dashboards describe the types of injuries sustained by the employees. Besides using global filter on the right of the storyboard, each individual chart on the storyboard can also be used as filter. This is created using tableau dashboard actions function which adds more interactivity to the users.
https://public.tableau.com/views/Assignment2_v2_0/Story1?:embed=y&:display_count=yes
References
Channel News Asia. (2016, May 11). Doctor suspended for giving construction worker 2 days' medical leave for fractured hand. Channel News Asia. Retrieved from http://www.channelnewsasia.com/news/singapore/doctor-suspended-for/2774298.html
Foo, J. Y. (2016, May 12). Foreign workers get shorter MCs because... The New Paper. Retrieved from http://www.tnp.sg/news/singapore-news/foreign-workers-get-shorter-mcs-because
Ho, O. (2016, August 2). Worker with crushed finger gets just 1 day off. The Straits Times. Retrieved from http:/http://www.straitstimes.com/singapore/manpower/worker-with-crushed-finger-gets-just-1-day-off
