IS428 2016-17 Term1 Assign2 Joanne Ong Shi Ying
Contents
- 1 Theme of Interest
- 2 Initial Questions to Investigate
- 3 Data Transformation
- 4 Questions Investigation
- 4.1 Question 1: Are experienced employees less prone to injuries?
- 4.2 Question 2: How does the number of accidents differ in different industries?
- 4.3 Question 3: At which point of the year / day do accidents happen more frequently?
- 4.4 Question 4: Is there a relationship between the size of the company / cause of injuries / severity of injuries and the time taken to report the accident?
- 4.5 Final Questions
- 5 Visualization
- 6 Conclusion
- 7 Tools Utilized
- 8 References
Theme of Interest
Singapore is constantly building and upgrading facilities. It is predicted that from 2016 to 2020, the amount of constructions contracts to be rewarded is between S$26 billion to S$37 billion. With a constant demand for construction, it is important to keep the industry with heavy manual work safe for the workers. Furthermore, there has been a rising trend of workplace injuries from 2011 to 2014.
This assignment aims to look at the various factors involve in the occurrence of workplace injuries and the efficiency of companies in reporting the accidents.
Initial Questions to Investigate
- Are experienced employees less prone to injuries?
- How does the number of accidents differ in different industries?
- At which point of the year / day do accidents happen more frequently?
- Is there a relationship between the size of the company / cause of injuries / severity of injuries and the time taken to report the accident?
Data Transformation
Columns Deleted
| Repetitive Columns |
|
| Columns not needed for analysis |
|
Changing of Accident Month Format
The accident month format is in 15/MM/1904 format. Hence, it is changed to MM using the formula below to facilitate the usage of the field.
Calculate the Number of Months Taken to Report the Accident
After changing the format of the accident month, the months taken to report the accident is calculated using the edited accident month format and the reported date using the formula below.
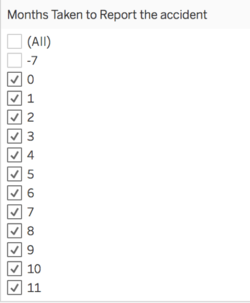
There is a record with -7 months taken to report the accident. It will be excluded from the investigate as it does not make sense for the accident to be reported before it happened.
Empty Fields
A total of 106 rows have empty fields. The empty fields are being labelled as NIL. Columns affected are: Informant’s Company Postal Code, Supposed Start Work Timing on Day Injured, Months Worked.
Questions Investigation
Question 1: Are experienced employees less prone to injuries?
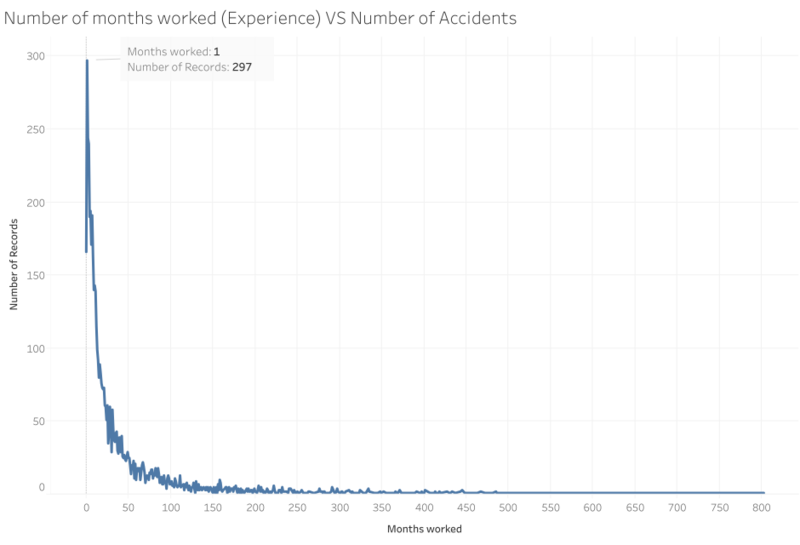
From the graph, it is observed that as employees become more experienced, they are less prone to accidents and injuries. In 2014, most accidents happened to employees who had only been working for a month.
Question 2: How does the number of accidents differ in different industries?
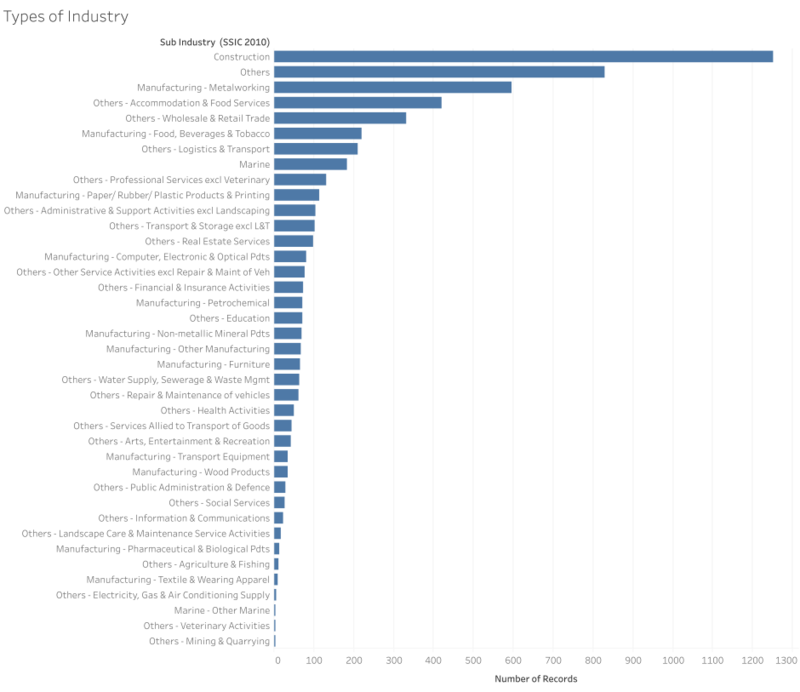
The construction industry has the most number of accidents, followed by others and metalworking manufacturing. However, this relationship might be too simplistic, hence I have decided to include percentage of manual work to further investigate.
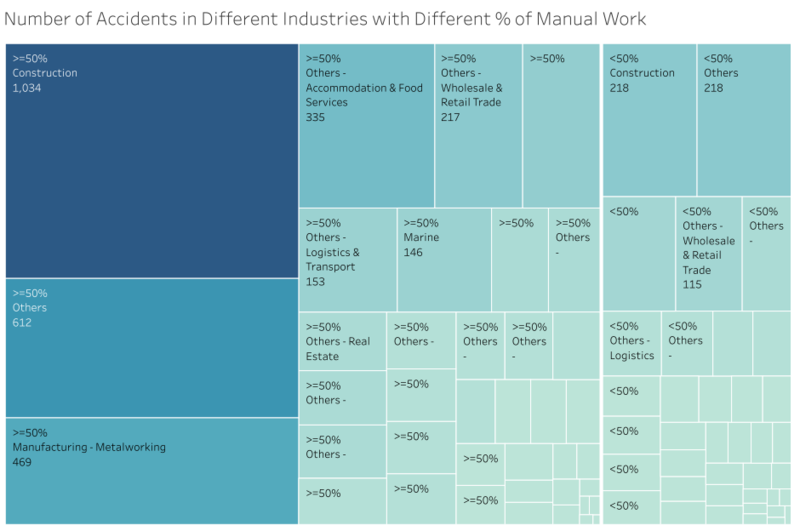
Refined Question 2: Is there any relationship between the percentage of manual work in different industries and the number of accidents?
Most of the accidents happened with manual work greater than 50%. In the different industries, it is evident that the construction industry has the most number of accidents occurring despite the percentage of manual work. Since the construction demand will be constantly present in Singapore, it is important to have more efficient measures for workplace safety.
Question 3: At which point of the year / day do accidents happen more frequently?
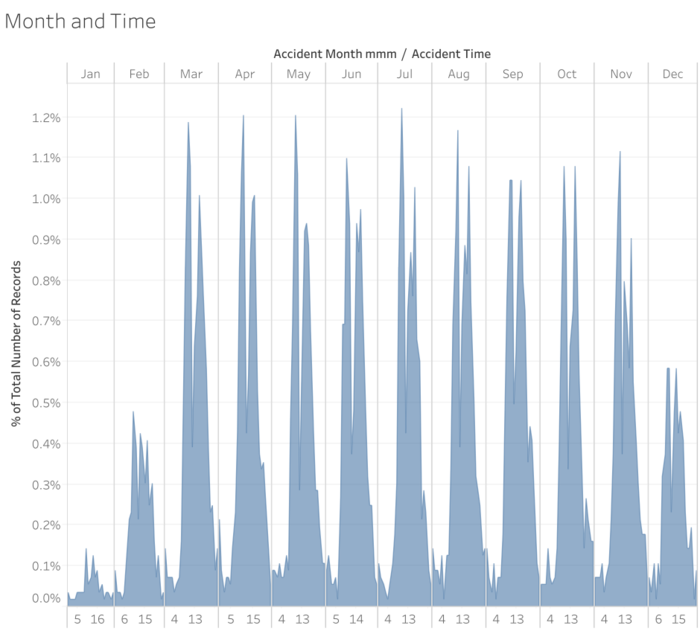
The trend throughout the day did not differ much in different months.
It is observed that for the number of accidents peaked from 1000 to 1100, dropped at 1200, which then increased to second highest from 1500 to 1600.
Question 4: Is there a relationship between the size of the company / cause of injuries / severity of injuries and the time taken to report the accident?
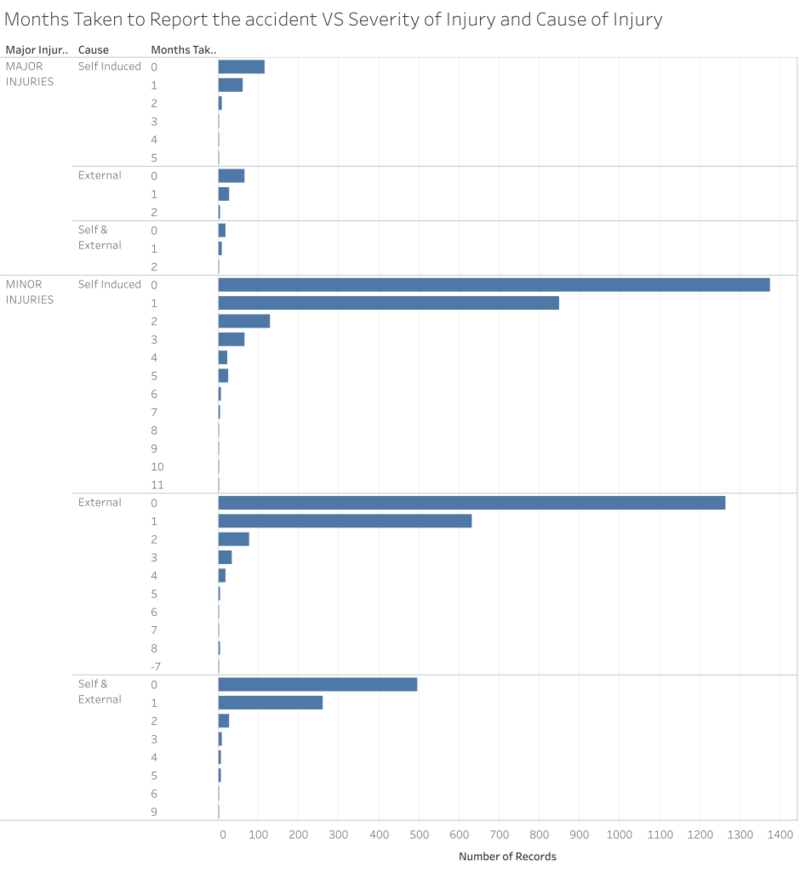
For different severity and cause of injury, the trend did not differ. The accidents are generally reported within a month or two from the accident date. Hence, I have decided to remove these variables from the question.
Refined Question 4: Is there a relationship between the size of the company and the time taken to report the accident?
The current dataset has the size of company in numbers, which makes it hard to investigate how the size of the company affects the time taken to report the accident. Hence, I grouped the size of company into 3 different groups.
| Number of Employees (X) | Group Title | Representation |
|---|---|---|
| 0 < X <= 50 | 1 - 50 | Small Company |
| 50 < X <= 250 | 51 - 250 | Mid-Size Company |
| X > 250 | More than 250 | Large Company |
The data field “Informant's No Of Employees” is being transformed into the different groups using the formula below.
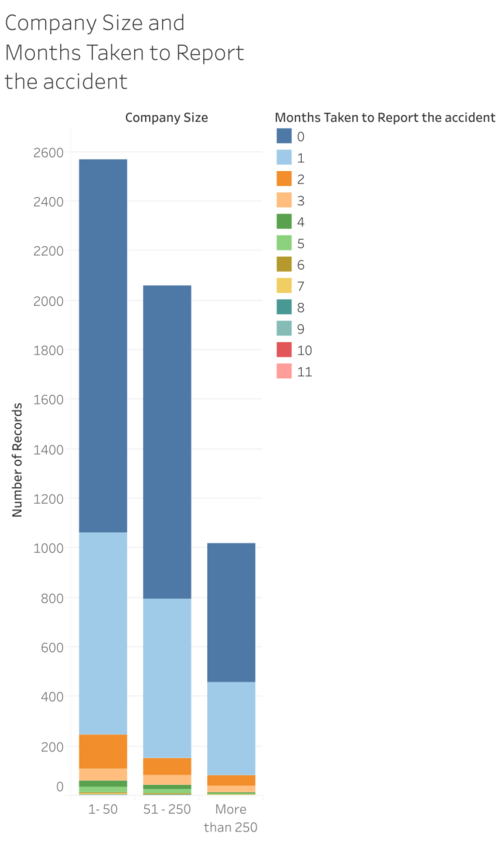
As seen from the graph above, it is observed that smaller companies tend to have more accidents occurring.
Also, the efficiency of the company is not affected by the company size. Companies with more than 250 employees reported most of the accidents within a month from the accident date.
Final Questions
- Are experienced employees less prone to injuries?
- Is there any relationship between the percentage of manual work in different industries and the number of accidents?
- At which point of the year / day do accidents happen more frequently?
- Is there a relationship between the size of the company and the time taken to report the accident?
Visualization
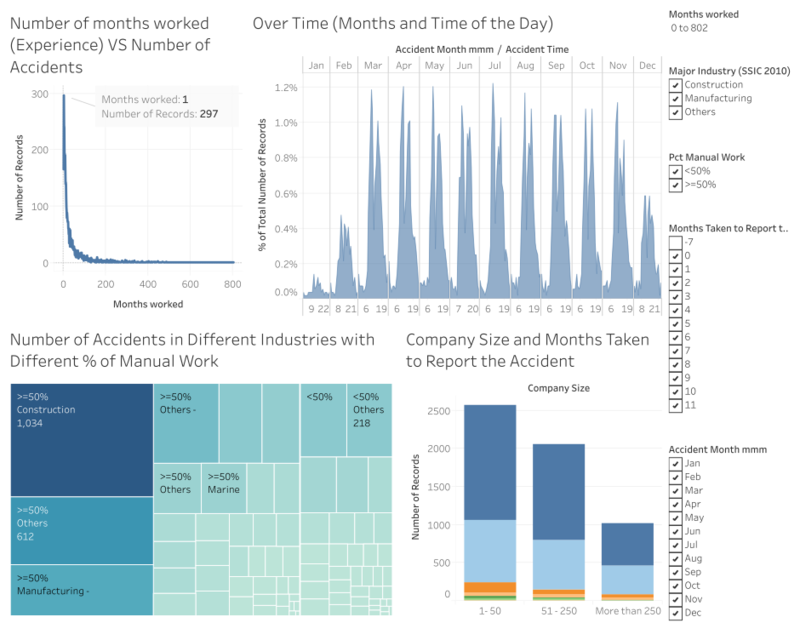
This visualization aims to analyze the relationship between the various factors (for companies and for employees) and the occurrence of workplace injuries in 2014. Also, the months taken to report the accident is taken into account in analyzing how efficient companies are handling the accidents.
It can be filtered according to the employees’ experience, major types of industry, percentage of manual work, months taken to report the accident and different months of the year.
Conclusion
In conclusion, there are various factors affecting the occurrence of the accidents. Inexperienced employees in the construction industry working from 1000 to 1100 have a highest tendency to be involved in workplace injuries. Hence, it is important to be extra cautious and have extra safety measures for employees and companies of profiles with higher risk of incurring workplace injuries.
Also, most companies are efficient in handling the accidents as most accidents are reported within a month or two after the accident date.
Tools Utilized
- JMP Pro
- Tableau
- Microsoft Excel
References
- Up to S$34b in construction contracts expected to be awarded this year. (2016, January 15). Retrieved September 25, 2016, from http://www.channelnewsasia.com/news/business/singapore/up-to-s-34b-in/2428208.html
