IS428 2016-17 Term1 Assign2 Chen Huiyan
Contents
The Theme of Interest
To focus on issues related to workplace safety by making use of Workplace Injuries Data 2014
Data Source
Workplace Injuries Data 2014. Reference: WSHI National Statistics Report 2014
Data format: excel
Define Questions for Investigation
- Initial Question
Is there a strong relationship between the number of workplace injuries and the type of industry?

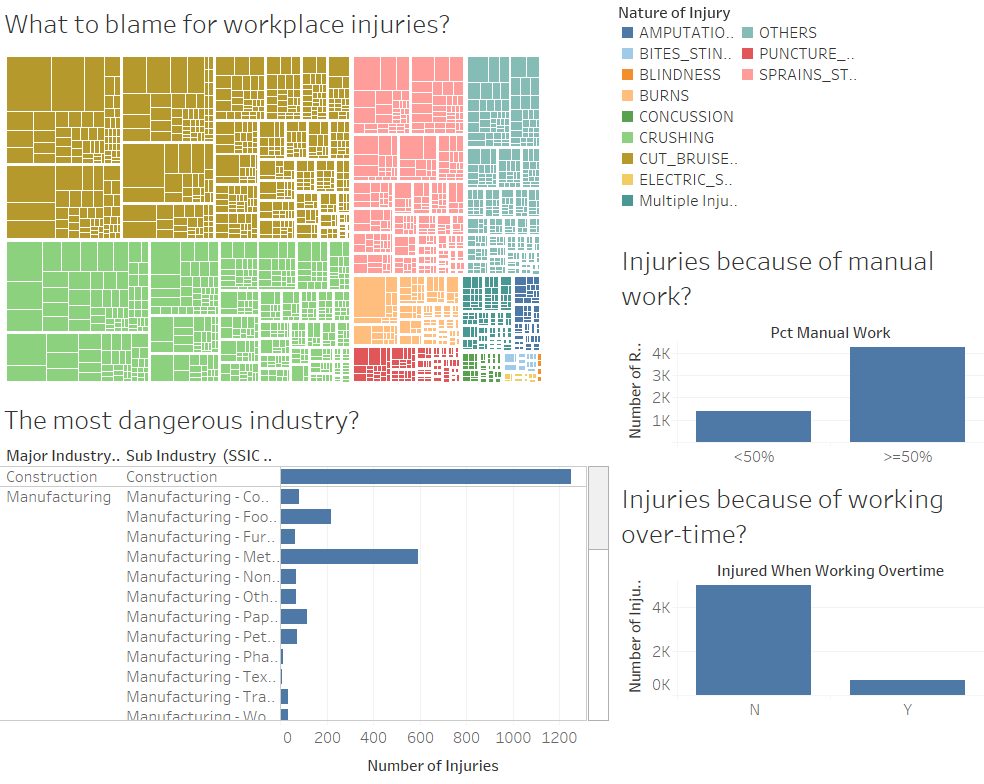
I have constructed a bar chart to show the relationship between major industry and the number of injuries in 2014. From the chart, it indicates that construction industry has the least number of workplace injuries which is out of my expectation. Therefore, I decide to break down the major industry.
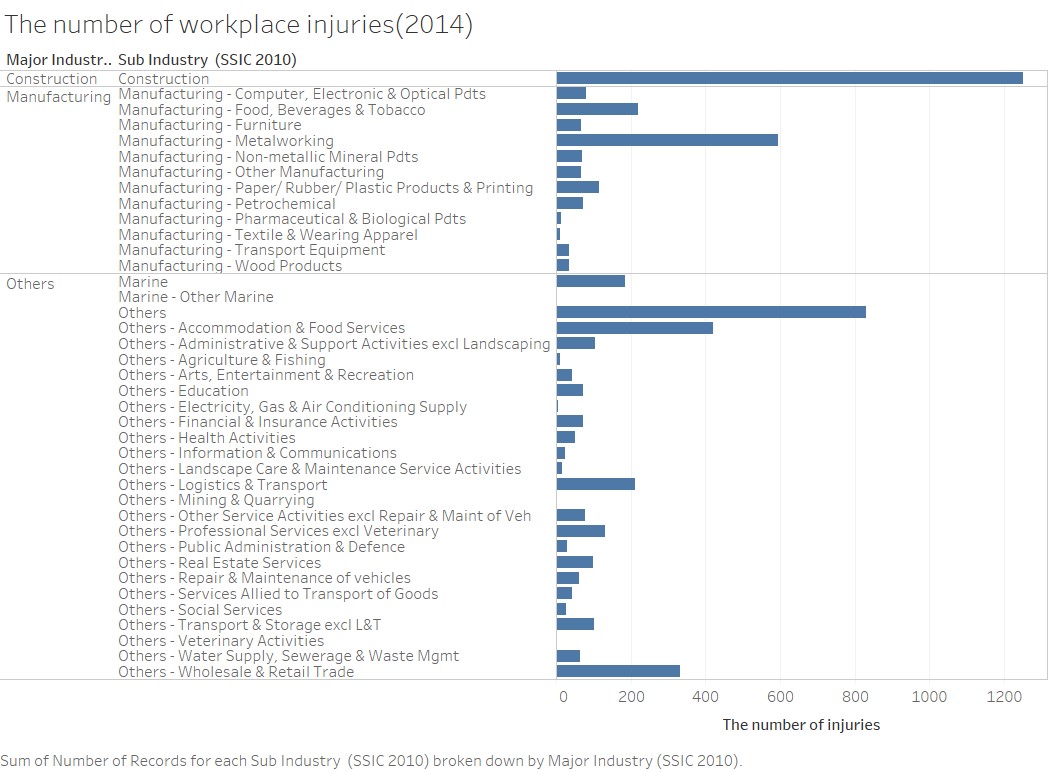
The chart is created by building hierarchies which clarifies my doubt regarding the previous chart as there are many sub industries under manufacturing and others industries leading to the high number of workplace injuries. After breaking down the major industries, construction is still the most dangerous industry in terms of the number of workplace injuries followed by metalworking under manufacturing and accommodation & food services under others (excluding others-others).
- Further Question
Are employees getting injured because of over work?
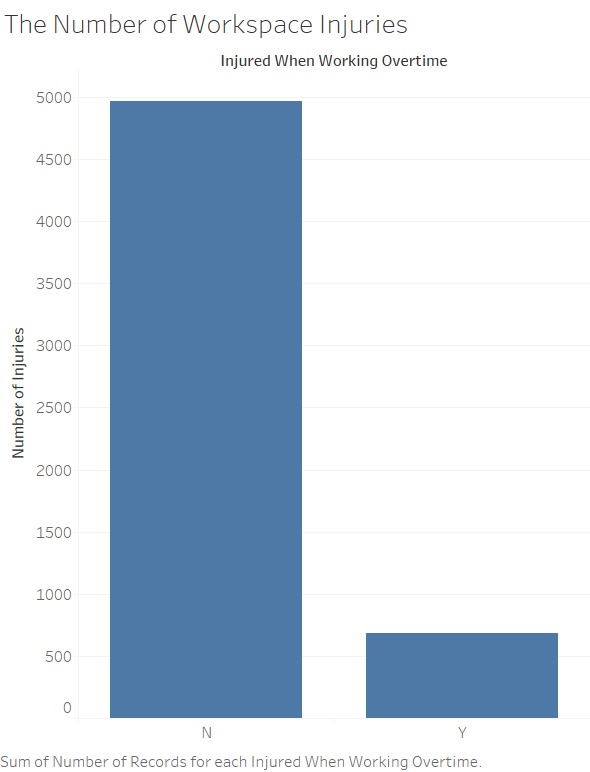
The bar chart shows that working overtime has nothing to do with workplace injuries since there are much more people getting injured during normal working hours.
- Further Question
Whether is manual work more dangerous in workplaces?

The bar shows that performing manual work is much more dangerous as there is high number of workplace injuries.
- Further Question
Are there any patterns of the nature of injury happened in workplaces regarding different industries?
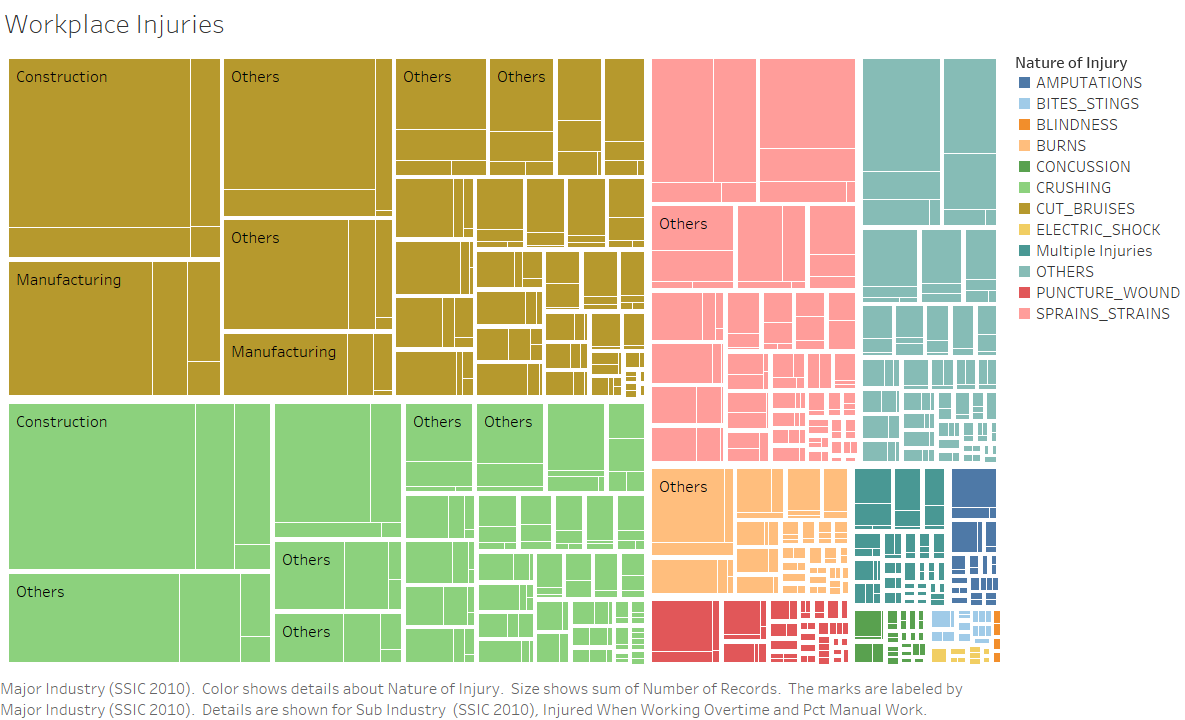
I have constructed a tree map to show the relationship between more than two variables. From the chart, I can tell cut bruises happened the most frequently in workplace followed by crushing and sprains strains that is because it is highly likely to get cut bruises, crushed and sprained in the construction industry that contributes to the most number of workplace injuries.
- Last Question
Which factors of the workplace are very likely to result in injuries in terms of different industries?
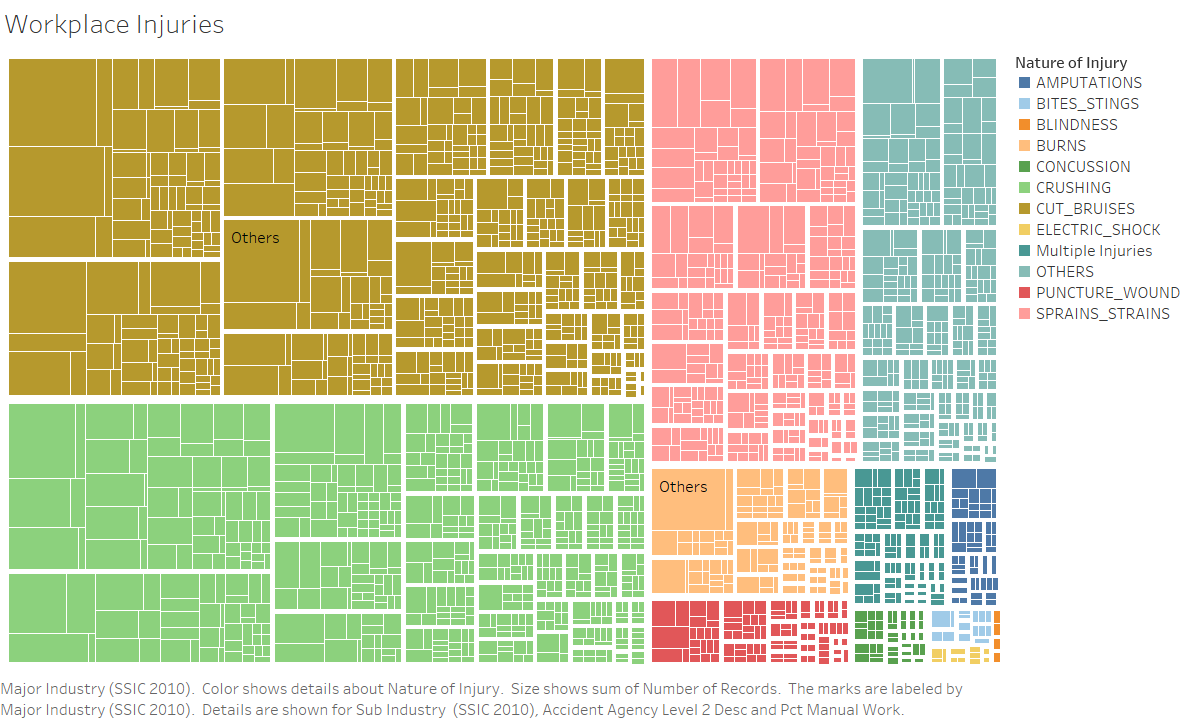
The tree map is further constructed by adding one more categorical variable which is accident agency level 2 description to get the final visualization.
- Metal items (excluding knives/needles) is the most dangerous part which brings about cut bruises and crushing in construction industry.
- Electronic hand tools also contribute much to cut bruises in construction industry.
- Knives/needles are the main cause for cut bruises in accommodation and food services.
- Metal items (excluding knives/needles) is also to be blamed to cause cut bruises under metalworking industry.
- Floor/level surfaces are the main cause for sprains strains
- Hot scalding liquid / steam mainly causes burns in accommodation and food services.
Final Visualization
URL to Interactive Dashboard : https://public.tableau.com/profile/publish/MA2_1/treemap#!/publish-confirm
Findings
From the above visual analytical graphs, in order to prevent workplace injuries, construction, metalworking and accommodation & food services industries are the main industries we should take actions where we should remind those workers to be more careful about metal items, electrical hand tools, knives/needles and hot scalding liquid/steam. There are some measures we can take to reduce the number of workplace injuries.
- Suggest employers to provide proper training for workers to learn how to use those tools.
- The manufacturers of those tools could come out with some protection methods to make them less dangerous to users.
- Since performing manual work is more dangerous to workers, implementing automation in workplaces may help reduce the number of injuries.
Tools Utilized
- Tableau to analyse and present data
- Excel to consolidate data
