IS428 2016-17 Term1 Assign2 Au Loong Zer Kirby
Contents
Theme of Interest
This project attempts to perform analysis from the 101 Innovations Research Tools Survey data set. With so many online tools available, the ones that researchers use vary across their roles and field. We try to establish a correlation between the characteristics of a researcher to the tools he/she uses, and subsequently, if exposure to certain tools have any bearing on whether they support the notion of open access, particularly pertaining to the area of science.
Investigative Questions
Initial Questions
- Is there a relationship between discipline and tools used?
- Is there a relationship between role and tools used?
- Is there a correlation between characteristics of a researcher/the tools they use to the support of open access? And if so, what are they?
Data Attributes
These attributes are included for analysis:
- Role
- Country Affiliation (Not Nationality)
- Discipline
- Tools/Sites for different functions of Research and Publication
- Support for Open Access/Open Science
Excluded Attributes:
- All open ended data
- First scholarly publication
- Language version of survey
Data Transformation
The data was from a survey which collected characteristics such as role and discipline. Thereafter, multiple sections will ask questions about the tools used in a specific research/publication function. At the end of these sections, the survey participant may include other tools which they might have used. To reduce the complexity of analysis, and also because these cases are few and very different, the first data decision I made was to remove these 'open ended' fields.
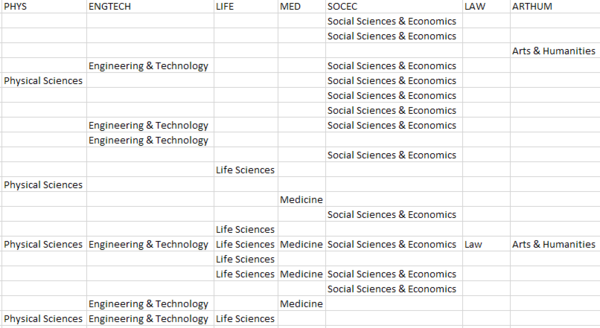
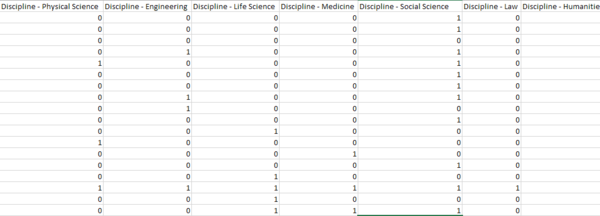
The options that were present in the survey was presented in a redundant manner. If a row was to indicate that a participant had chose the option, the cell would input data that is essentially repeating what the column header is. I have decided to change the cell data to binary (1,0). There are a few reasons for this. First, this eliminates blanks in the data. Second, using sum on the column would serve as a measure for how many survey participants selected the option. Column headers were also rephrased for easier reading.

