IS428 2016-17 Term1 Assign1 Nguyen Luong Thanh Minh
Contents
Abstract
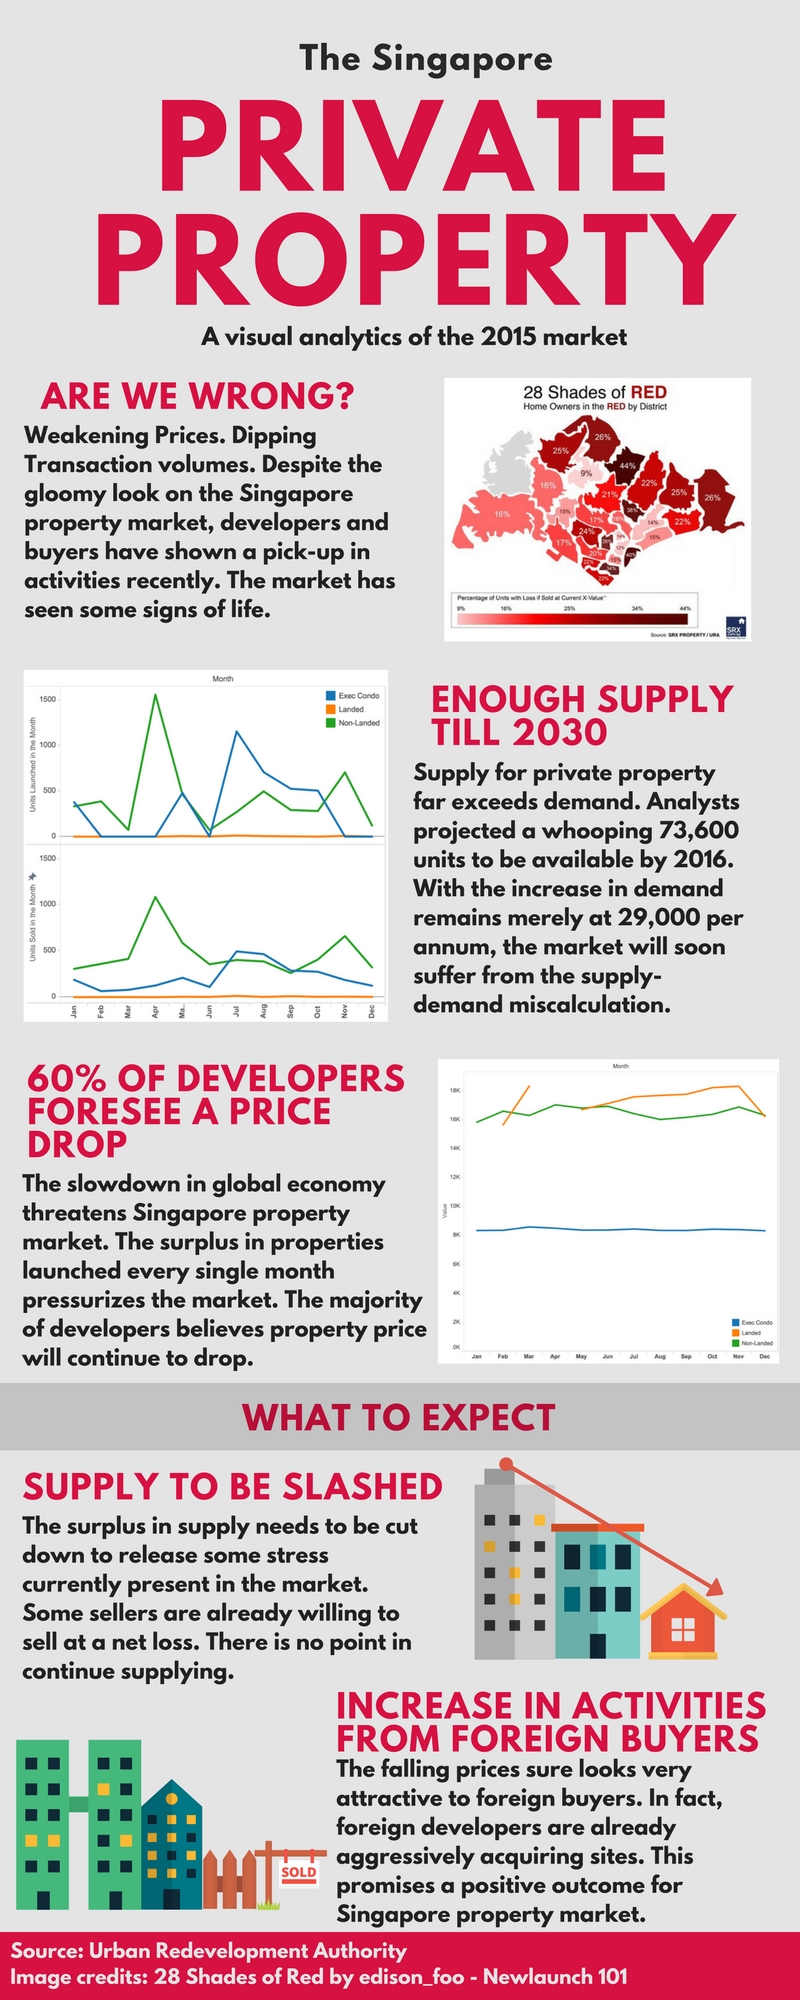
2015 is projected to be a futile ground for private properties in Singapore. Domestic and foreign investors are warily keeping abreast of a debilitating economic climate, given the ongoing downswing in prices and transaction volumes. Despite the fact that there are still some light of activities, the current situation continues to look gloomy. Most buyers continues to wait on prices to fall within their comfortable price range. Observing the past trends, it is common to assume private properties price will continue to fall in the upcoming months. This project aims to apply visual analytics to analyze the 2015 property market in Singapore.
Problem and Motivation
The recent slowdown in the private property market puts a great pressure on both developers and buyers. Understanding the patterns behind the changes in private property market can provide us with great hindsight to come up with policies that might help soothing the problem.
One of main problems this project aims to solve is understanding the trend in private property price in Singapore. Hence, by analyzing both supply and demand factors, come up with a possible theory on explaining why such a trend in price is observed. This theory is the foundation for the policies recommendations that might help improve the current issue.
The variables this project deals with are mainly different price of different private property types in Singapore, along with how many units are being supplied and sold within the given time frame. After analysis is carried out, this project would aim to question the following policies: Allowing HDB owners to purchase additional properties and cut down private property supply by 25%.
Approaches
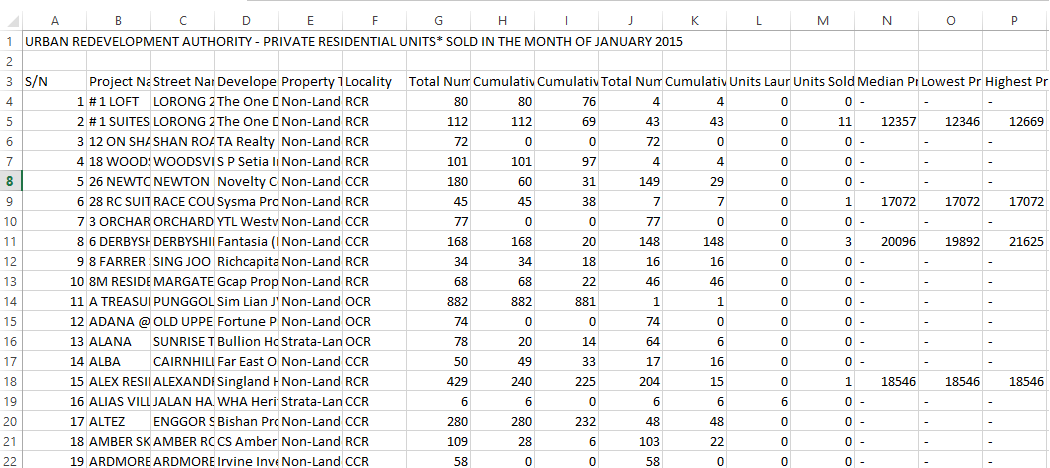
Data used in this project is obtained from Urban Redevelopment Authority database. Raw data obtained was in .csv format, containing information regarding Total Number of Units in Project, Cumulative Units Launched to-date, Cumulative Units Sold to-date, etc. for each property type and each project, for a specific month. The image below shows a snapshot of the raw .csv file obtained from URA for the month of January 2015.
Data for the subsequent months (from January 2015 to December 2015) was downloaded individually and compiled to a large file.
Data Cleaning
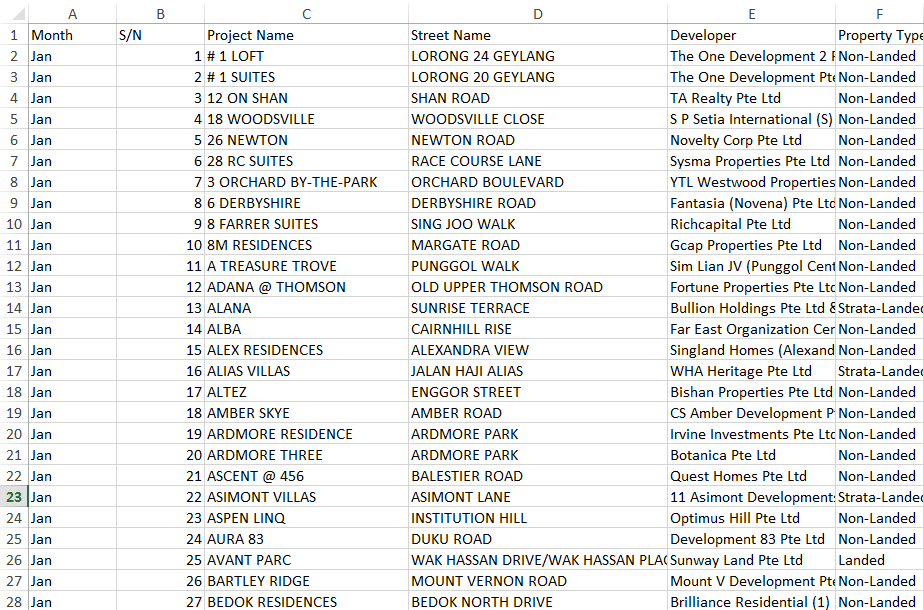
The compiled Excel file, despite containing enough information for analysis, was not at a usable state and needed to be cleaned. A month column was added and additional unnecessary texts were removed.
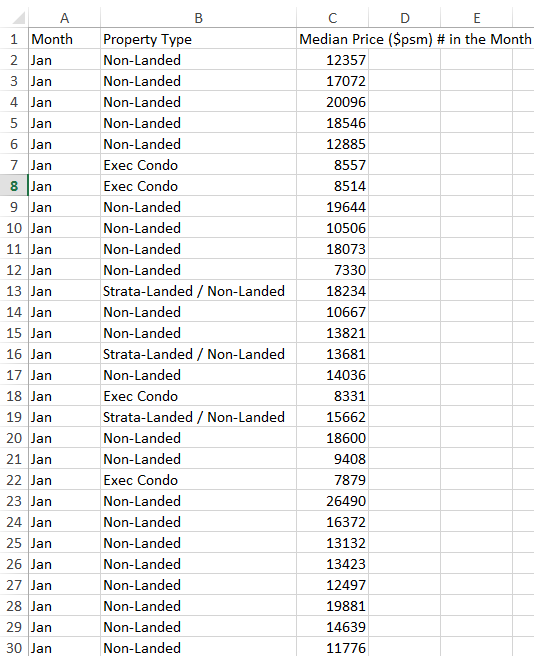
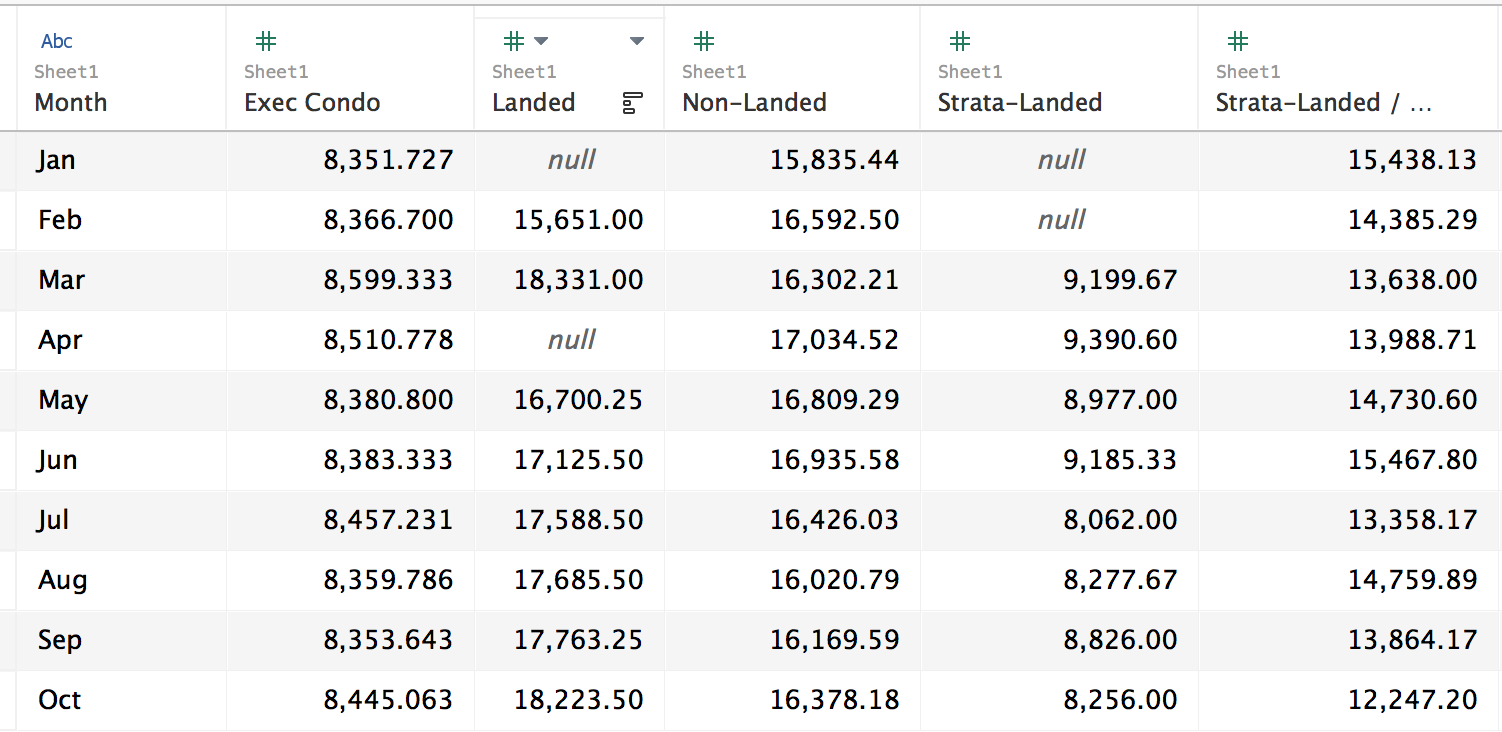
To obtain necessary data for price trend analysis, further cleaning is required. Many price values appear to be "-", these are null data and were removed to avoid confusion. As we are taking median price as a benchmark, the other 2 columns were also removed. The following table was then obtained.
However, this table is hard for Tableau to make sense out of. A pivot table was then used to obtain the following table.
Tableau Data Visualization
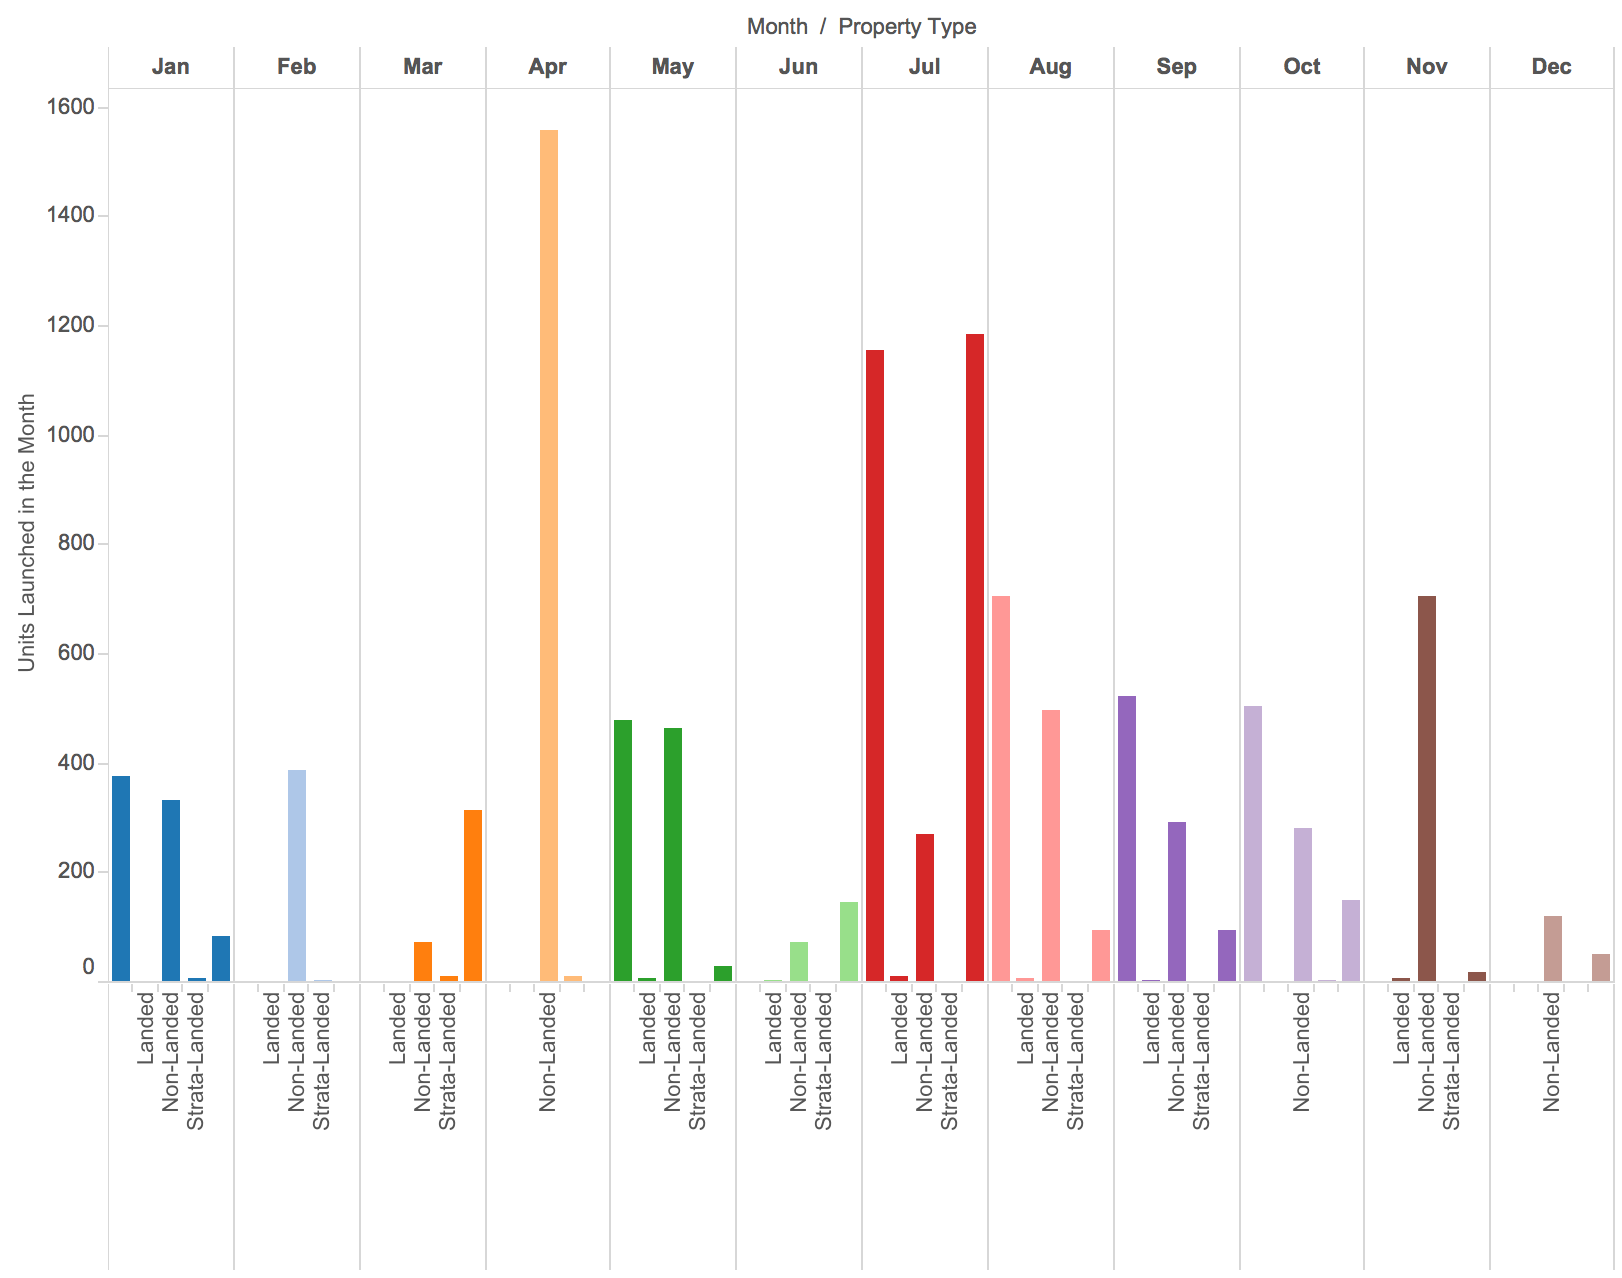
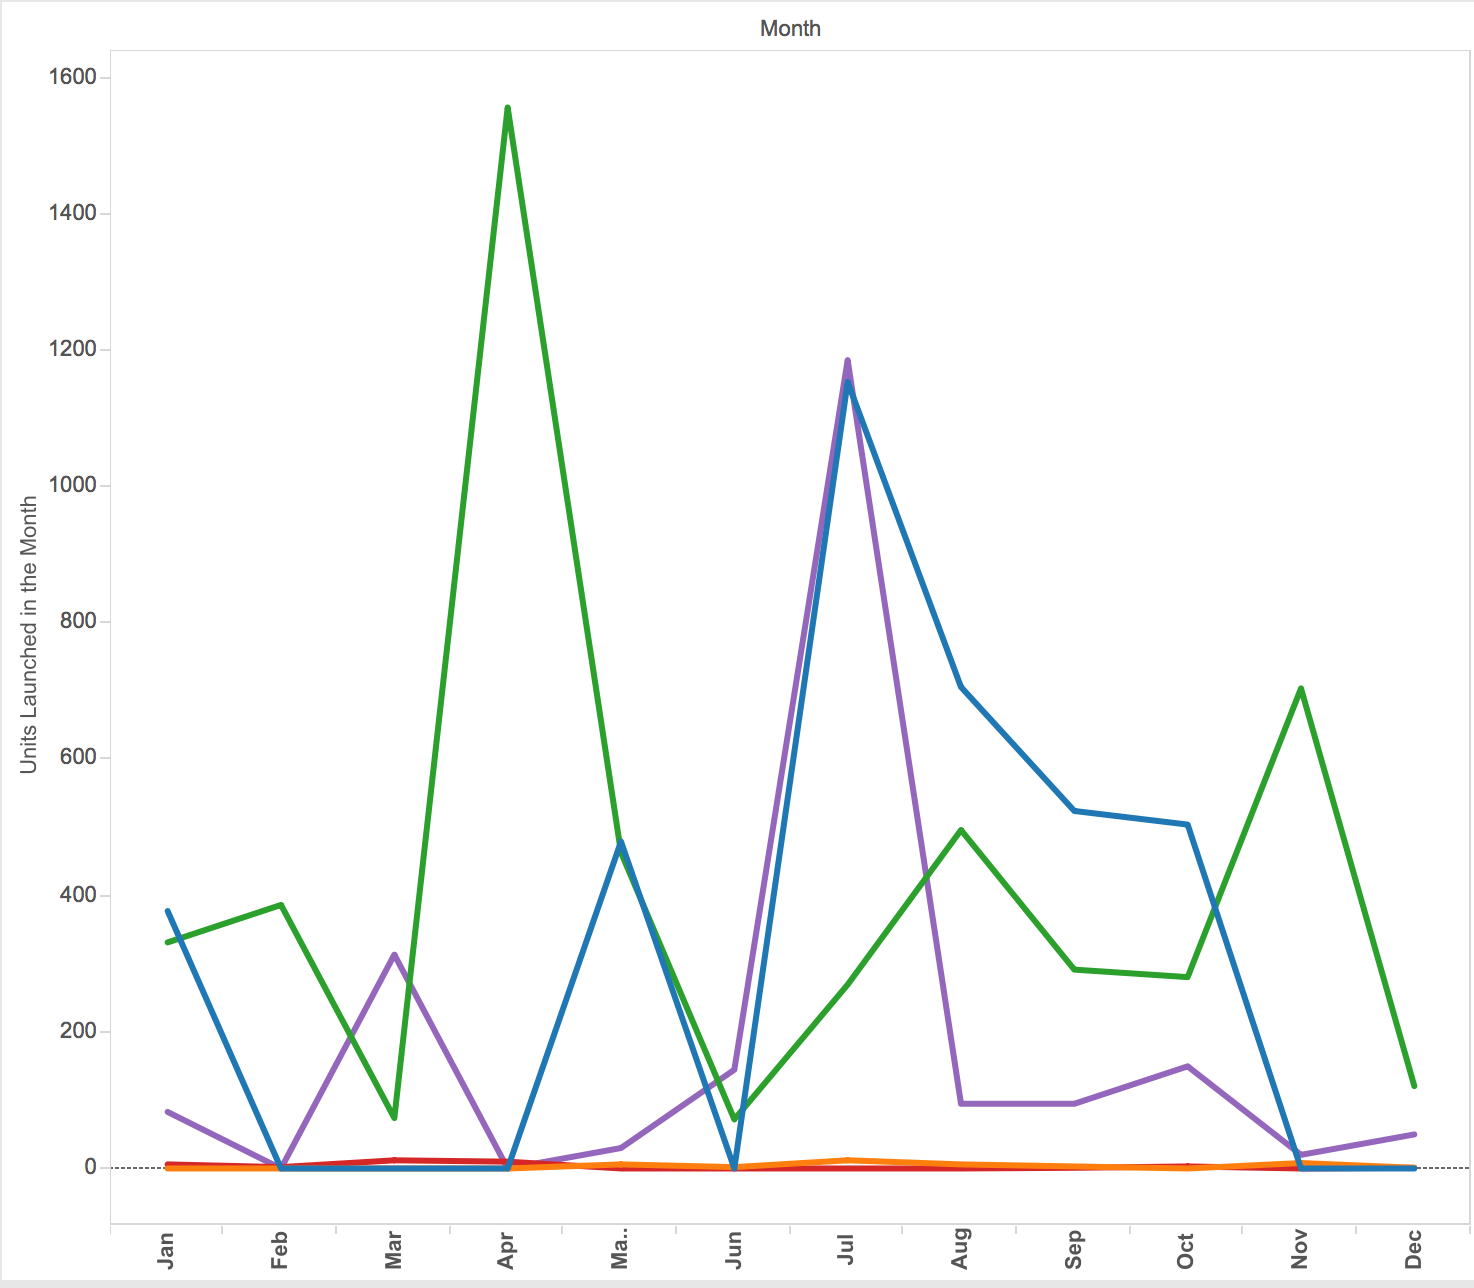
In order to analyze the private property supply based on property type, a side-by-side bars graph is plotted with Month and Property Type as column, SUM(Units Launched in the Month) as rows. However, this graph is visually hard to make sense of. Therefore, additional changes were made to obtain a lines graph which clearly shows the trends in market supply.
Trends observed from the graph are:
   - Landed properties supply remains stably the lowest. This is due to limited land space in Singapore. Per square meter price is also one of the highest for landed properties.
   - All types of properties see a decline in supply towards the end of the year. This might be due to government policies on cutting down supplies or simply due to a decline demand.
   - Both Executive Condo and Non-Landed properties see great fluctuations throughout the year in terms of demand. However, peak period for each type of property happens on different months.
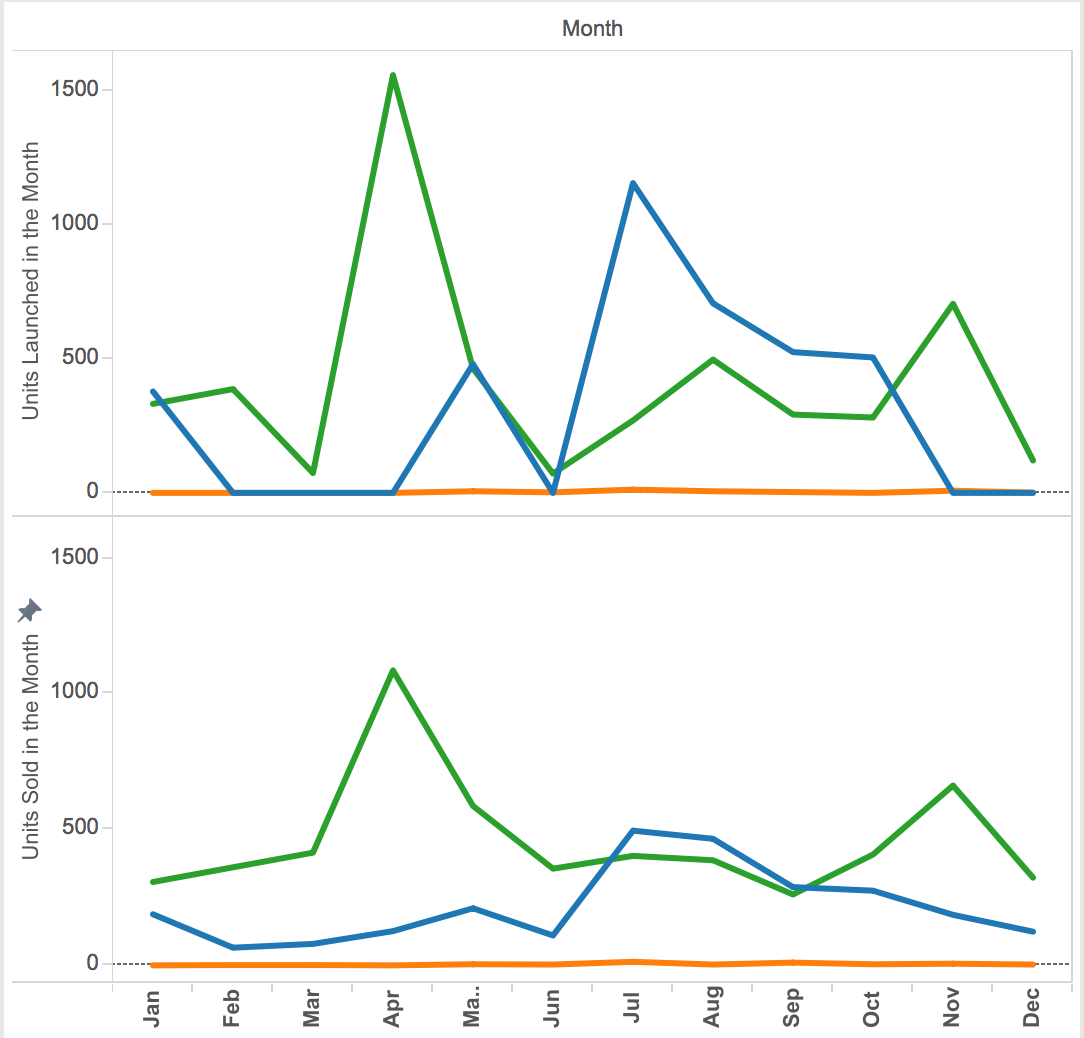
However, observing merely supply trend is not enough to come out with a sound explanation for the current issue. Hence, another measure was added to analyze the market demand for the year of 2015 and hence observing its trend.
Y-axis for demand graph was modified for a more comparative look. From here, we can see that supply far exceeds demand. This causes a great surplus and drives down price greatly.
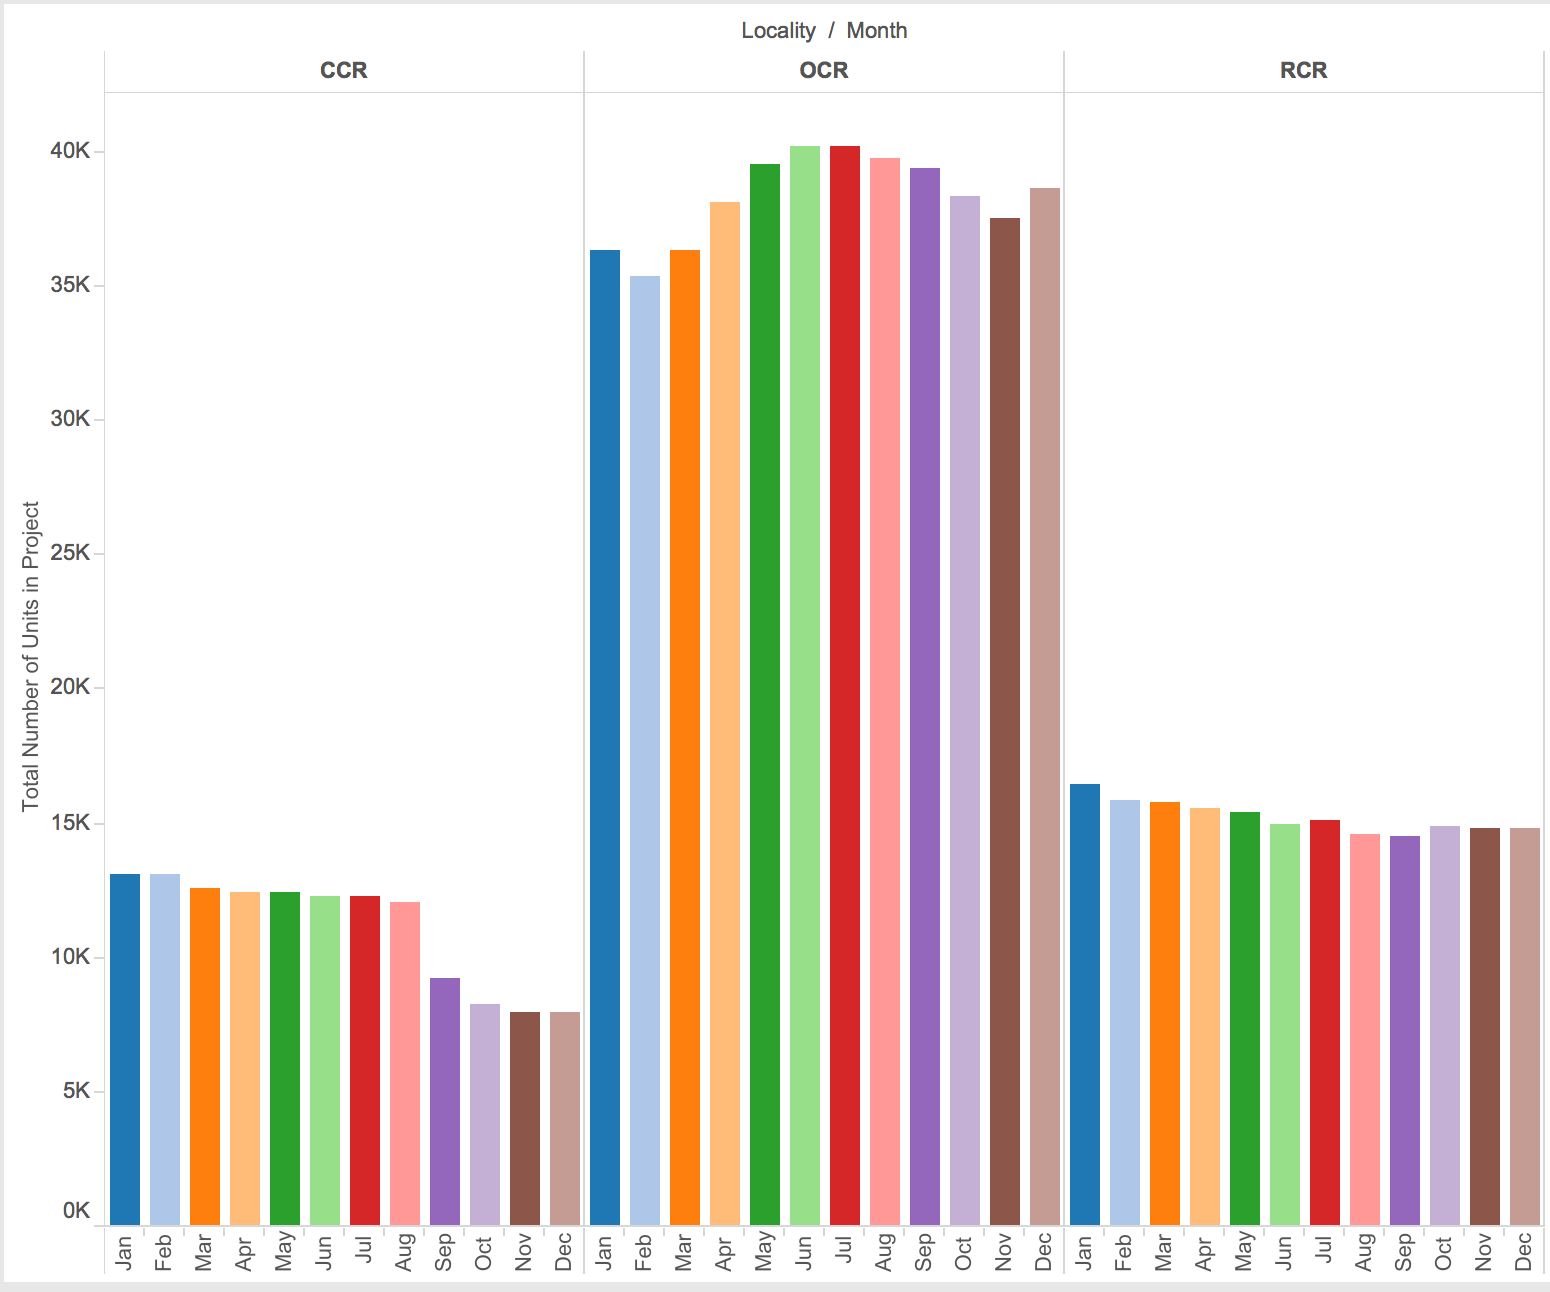
Further analysis shows that Outside Central Region receives the highest amount of private property units.
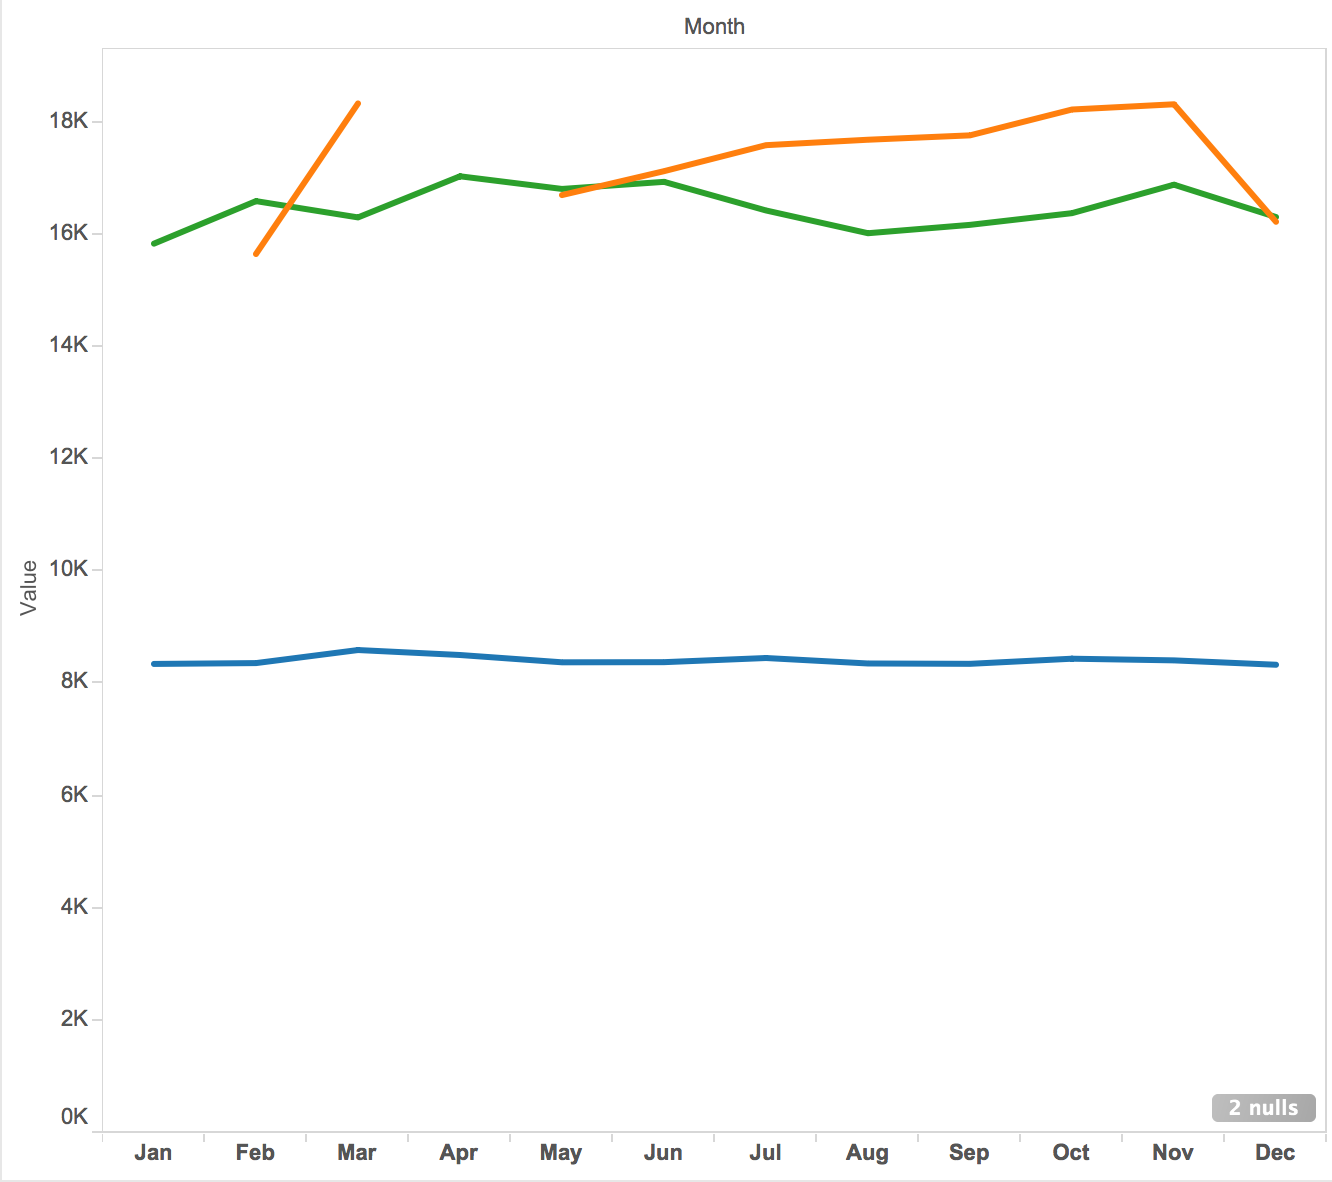
In order to analyze trends in price, we use the further cleaned up data as mentioned above. However, due to 2 missing values (lack of information from source), the graph obtained is missing some information but still provide enough insight for analysis.
Trends observed for price (per square meter) of private properties in Singapore 2015 are:
  - Price of Executive Condo remain fairly constant throughout the year.
  - Price for all types of properties see their peaks during the first and last quarter of the year.
  - Price for all types of properties see a decline towards the end of the year.
This tallies with the above discovery of supply surplus driving down price. At this rate, price will continue to fall while buyers continue to observe the market, causing great pressures for developers if nothing is to be done.
Tools Utilized
Microsoft Excel 2015, Tableau 10.0.0
Results
According to analysis, the constant surplus of supply in private properties, with demand nowhere to be keeping up, causes a great dip in price and stagnant on the market. As such, policies should be recommended to help solve the issue:
  - Cut down on supply. This can be done through government interventions, such as quota or increase on cost for developers.
  - As mentioned at the beginning, allow HDB owners to purchase private properties. This will increase demand and balance out the market.
  - The government should also create opportunities for foreign buyers to tap into the market. This will not only increase demand, but also generates income for Singapore as well as generating revenues through investments.
