IS428 2016-17 Term1 Assign1 Lim Hui Ting
Contents
Abstract
In recent years, there is a growing concern of oversupply of residential property in Singapore which many speculate that it could be due to the cooling measures in place that led to a sharp fall in demand for private residential property amid hefty supply. Thus, this assignment aims to analyse the private residential property market in Singapore by looking at the supply and prices of these properties in 2015 and provide recommendations to the current housing policies for 2016.
Our analysis shows that the current private residential property market is not stable enough for the cooling measures to be lifted off due to an increasing trend of speculative buying in the Condominium market. However, the possibly oversupply of Condominium in the market may requires necessary adjustments to the current housing policies before a downward spiral of Condominium prices occur.
Problem and Motivation
An article from TODAY newspaper in 2015 states that the current housing supply in Singapore will be able to meet the demand up till 2030. The article highlights a growing concern of the oversupply of residential property in Singapore (Ku, 2015). This could possibly due to the cooling measures in place since 2009 in order to alleviate the overheated housing marketing in Singapore. Mr Augustine Tan, president of the Real Estate Developers' Association of Singapore (REDAS), said the successive introduction of the measures since 2009 had led to a sharp fall in demand for private residential property amid hefty supply (Goh, 2016).
There are ongoing debates on whether the cooling measures should be lifted. Analysts are speculating that some property cooling measures might be relaxed in 2016 due to consecutive quarters of decline in the housing price index (Singapore Business Review, 2016). On the other hand, a news article from Straits Times states that the cooling measures are unlikely to be eased or adjusted in 2016 as the interest rates are likely to remain low and investors continue to look into the real estate market for higher returns and low risks investments.
Thus, it is important for us to analyse the current private residential properties situation in Singapore by looking at the supply and price in order to determine if there is indeed an oversupply of housing in Singapore and whether the current cooling measures should be lifted.
Approaches
1. Data Preparation
As Executive Condominium(EC) is a special type of housing in Singapore excluded as it is a hybrid between public and private property, EC is excluded from the subsequent analysis. Thus, only datasets relating to Apartment, Condominium, Detached House, Semi-Detached House and Terrace House are retrieved and analysed for this assignment.
Datasets for the supply and prices of private residential properties in Singapore are retrieved from REALIS Timeseries and Transactions tab respectively. Due to the restrictions on REALIS database, datasets are downloaded in batches and subsequently combined using Excel.
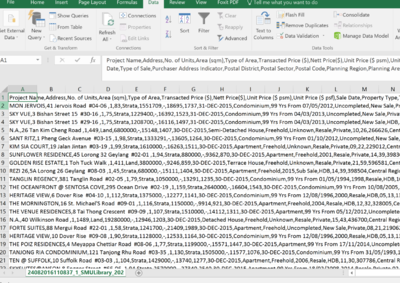
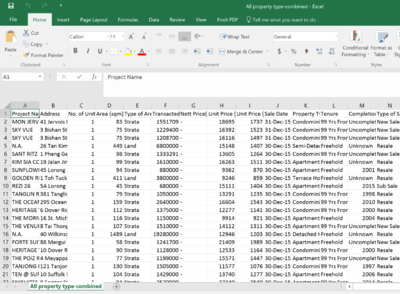
As the initial datasets downloaded are in comma limited form, as shown in the left screenshot, Excel’s text to column function delimited by comma is used to transform these datasets into respective columns, as shown in the right screenshot. These datasets are subsequently imported into Tableau to create visualisations. Inforgraphics is created using the dashboard function is Tableau.
2. Use of Chats
2.1 Box Plots
Box plots are used to visualise the distribution of private residential properties prices in Singapore. This is because the variables involved both categorical data(i.e Property Type) and continuous data(i.e unit price per meter square). Box plots are able to illustrate the distribution of the unit prices more effectively than bar charts providing details such as the different quartile groups, outliers and allow the readers to be able to compare across the various property types more effectively.
However, we understand that box plot can be deceptive in datasets that have a bimodal distribution. In datasets that have a bimodal distribution, bar charts will be used to complement the findings in the box plots.
2.2 Line Graphs
Line graphs are used to visualise the private residential properties supply Singapore. This is because the dataset contains a column called “time” where it has the data for the four quarters of various years. Line graphs are more effectively in showing the trends of Singapore’s private residential properties supply for the four quarters in 2015.
2.3 Marimekko Charts
Maimekko Charts are used to visualise each property type supply and vacancy in various planning regions over time respectively. This is because various dimensions and measures of the data are required to be added into the chart which might be complicated for other charts such as bar graph. Using Marimekko charts, we are able to visualise the various contributions of the different property types in the private housing market in Singapore.
3. Analysis Approach
In the datasets, there are 3 types of sales namely new sale, sub-sale and resale. According to URA, the definition of the different types of sales are as follows:
New Sale: The sale of a unit direct by a developer before the issuance of the Certificate of Statutory Completion and the Subsidiary Strata Certificates of Title or the Certificates of Title for all the units in the development.
Resale: The sale of a unit by a developer or subsequent purchaser after the issuance of the Certificate of Statutory Completion and the Subsidiary Strata Certificates of Title or the Certificates of Title for all the units in the development.
Subsale: The sale of a unit by one who has signed an agreement to purchase the unit from a developer or a subsequent purchaser before the issuance of the Certificate of Statutory Completion and the Subsidiary Strata Certificates of Title or the Certificates of Title for all the units in the development.
Speculators are usually more involved in subsale transactions. Since the market varies for the different type of sale, we will analyse the distribution of the unit price and supply for the different types of sales separately.
Tools Utilized
Excel: Data transformation and merging of datasets
Tableau: Create graphs and inforgraphics
Analysis on Private Residential Properties Supply
1.Available Units
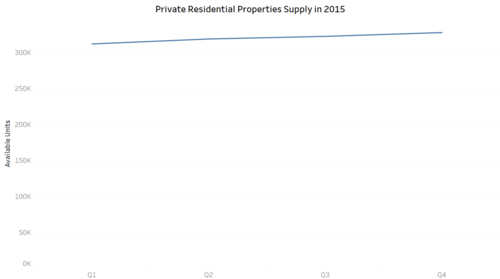
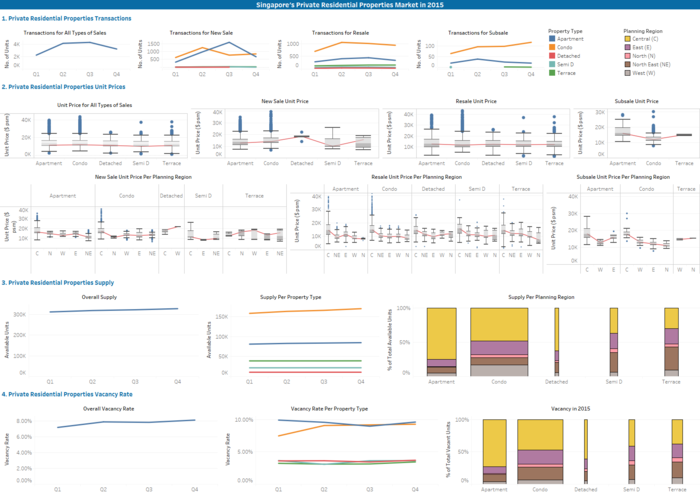
The number of available units for private residential properties increases throughout the four quarters in 2015. However, this increase is gradual which suggests that not a lot of units are introduced in each quarter.
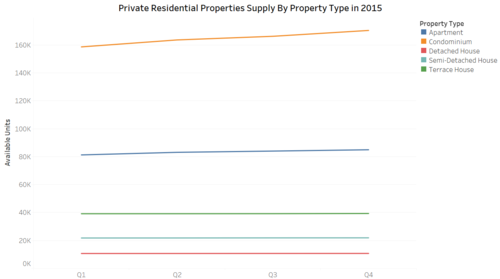
Condominium has the most number of available units as compared to the other private residential properties. The supply of condominium might be more than the demand as observed from the increasing trend of supply of condominium in 2015. The supply of Apartment, Terrace House, Semi-Detached House and Detached house remains relatively the same in 2015 which might suggest a weak demand for these private residential properties.
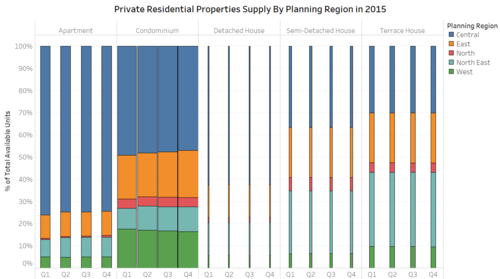
As seen from the chart above,out of all the units available in the market,majority of the available units came from Condominium whereas Detached House contributes the least to the number of available units in the market. For all the private residential properties, majority of the supply of each property type is in the central region whereas there are lesser number of units available in the north region.
2.Vacancy Rate
Vacancy rate is computed using Tableau’s calculated field with the following formula:
Sum([Vacant Units])/SUM([Available Units])
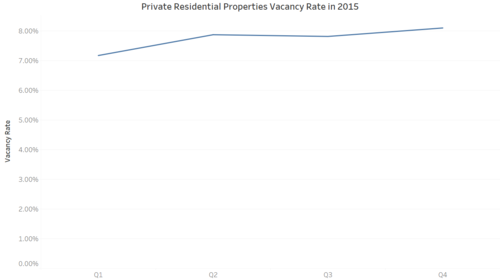
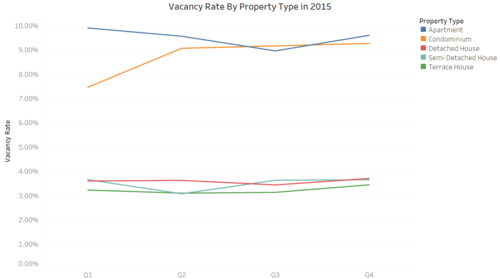
Vacancy rate for private residential property increases in 2015. Apartment and Condominium has a higher vacancy rate as compared to the other properties. Vacancy rate for condominium increases sharply between the first and second quarter of 2015 and increases gradually from second quarter onwards. Apartment vacancy rate decreases between first and third quarter of 2015 and increase in the fourth quarter. Detached House, Semi-Detached House and Terrace House have relatively the same vacancy rate.
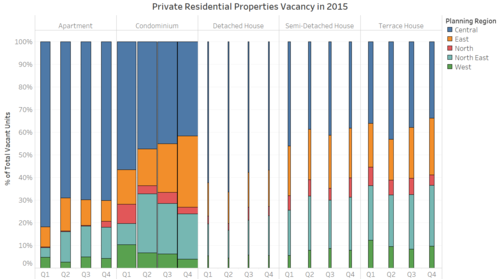
As seen from the chart above,out of all the vacant units in the market,majority of the vacant units came from Condominium whereas Detached House contributes the least to the number of vacant units in the market. For all the private residential properties, majority of the vacant units are in the central region whereas there are lesser number of units available in the north region.
For Condominium, the percentage of vacant units from Central region decreases whereas the percentages of vacant units from North East and East region increases.
3.Policies Recommendations
3.1 Collaboration Among REDAS and Relevant Government Agencies
The increasing supply of Condominium in the market is a cause of concern as it could lead to an oversupply of Condominium. This not only suggests an inefficient use of land in land scare country like Singapore, but also could lead to a downward spiral of Condominium prices. Low prices might affect the quality of the properties as developers have to face rising development costs and operational obligations.
The Real Estate Developers’ Association of Singapore(REDAS) might want to collaborate with the relevant government bodies to provide their inputs on how the current housing policies, such as the cooling measures, can be revised in order to prevent the oversupply of Condominiums in Singapore.
Analysis on Private Residential Properties Transactions and Prices
1.Overall
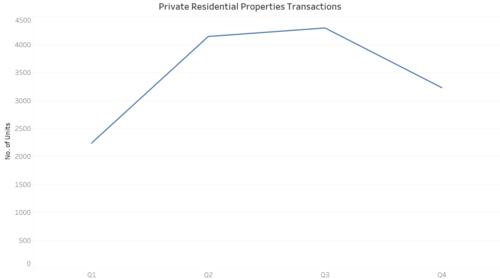
By looking at the time series graph, the sales of private residential properties increase from the first quarter to the third quarter of 2015 and peaks at the third quarter before dropping at the fourth quarter. This drop in the sales is deemed as reasonable as it is the characteristic of the last quarter for housing market where other factors such as year-end holiday period have a greater influence on the sales of private housing properties(Ong, 2015).
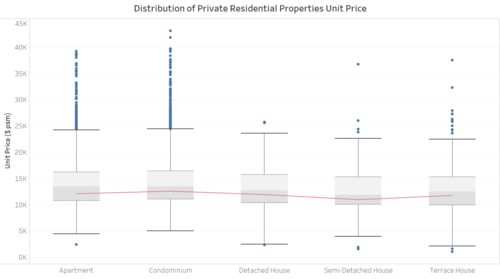
From the box plot above, it seems that the median unit prices for the 5 different property types are relatively the same. However, Apartment and Condominium has more outliers as compared to the other 3 property types. This suggests that the unit prices for Apartment and Condominium generally have greater variation which might imply that the market for these two properties can be quite unpredictable.
As mention in APPROACHES,since the market varies for the different type of sale namely new sale, sub-sale and resale, we will analyse the distribution of the unit price for the different type of sale separately.
2.New Sale
2.1 New Sale Per Property Type
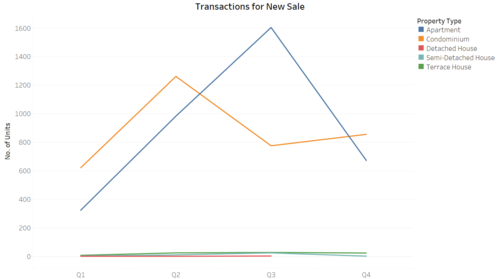
New sales of Apartment peaks at third quarter of 2015 whereas new sales of Condominium peaks at second quarter of 2015 after which new sales dropped at third quarter of 2015 and increases at the fourth quarter of 2015. The new sales of the remaining 3 properties remains relatively unchanged throughout 2015. Out of the 5 properties, it seems that the new sale of Condominium has a greater variation in 2015.
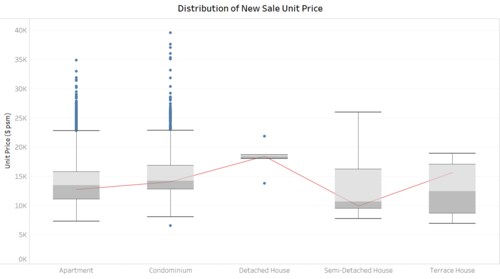
There is a greater variation in the median unit price of the 5 different property types as compared to the box plot above. Similarly, Apartment and Condominium has more outliers as compared to the other 3 property types. For detached house, a relatively short box plot is observed which imply that the unit prices do not vary much. For semi-detached house, the longer upper whisker imply that unit price is more varied for unit prices that exceed the median unit price and more similar for unit prices that fall below the median unit price.
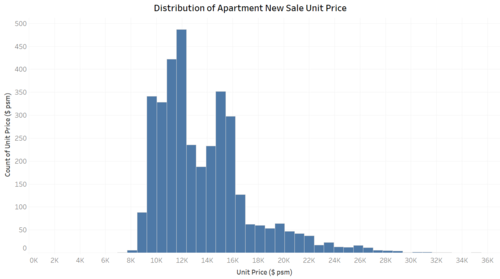
Box plot can be deceptive in datasets that have a bimodal distribution. For new sale, a bimodal distribution is observed for the unit prices of Apartment when plotted on histogram but this particular distribution cannot be observed on box plot. This suggests that other factors such as the location of the Apartment might result in the bimodal distribution of unit prices in the new sale of Apartment.
2.2 New Sale Per Property Type and Planning Region
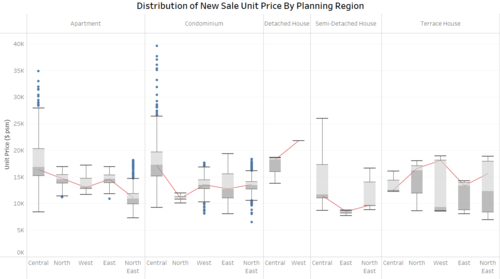
By looking at the box plot of new sale unit price by planning region, most of the private residential properties have greater variation in the median unit price which suggests that the location has a significant influence on the new sale unit prices of these properties. Apartment, Condominium and Semi-Detached House have a greater variation of unit price in the Central region as compared to other regions. The median unit price is highest in the Central region for Apartment, Condominium and Semi-Detached House whereas the median unit price is highest in the West region for Terrace House.
3.Resale
3.1 Resale Per Property Type
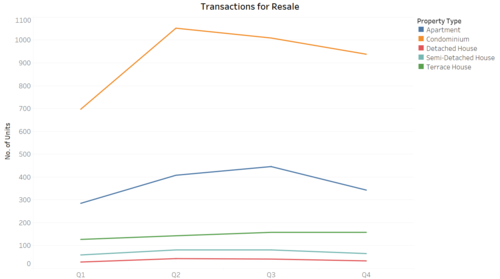
Condominium has a greater number of resale transactions as compared to the other private properties. Condominium resale transactions peak in the second quarter of 2015 whereas Apartment resale transactions peak in the third quarter of 2015. As compared to the new sale time series graph above, Detached House, Semi-Detached House and Terrace House have more transactions in the resale market as compared to the new sale market.
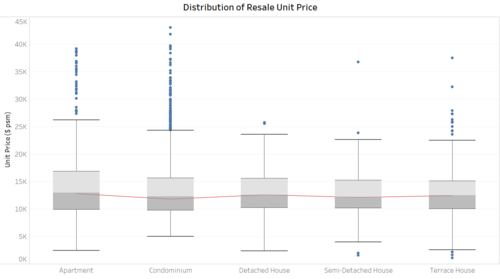
For resale, the median unit prices for the various property types are relatively the same. Similarly, Apartment and Condominium has more outliers as compared to the other 3 property types.
3.2 Resale Per Property Type and Planning Region
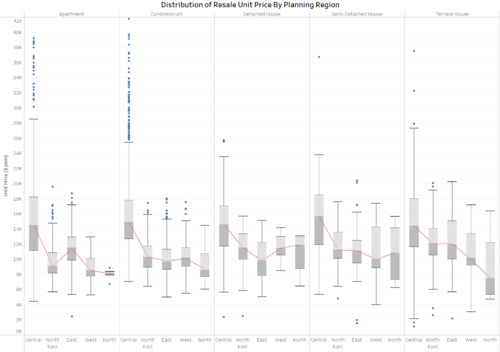
By looking at the box plot of resale sale unit price by planning region, most of the private residential properties have greater variation in the median unit price which suggests that the location has a significant influence on the resale unit prices of these properties. All the 5 properties have greater variation in the unit prices in Central region as compared to other regions.
For Detached House, there are greater variations in the location of the properties transacted in the resale market as compared to the new sale market(ref to 2.2 New Sale Per Property Type and Planning Region).
4.Subsale
4.1 Subsale Per Property Type
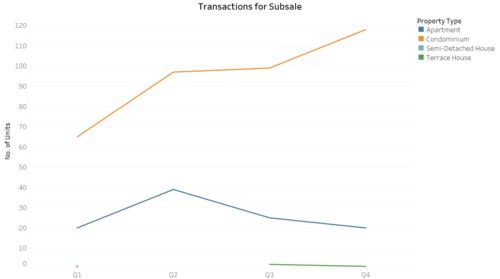
In general, there are lesser subsale transactions of private residential properties as compared to the new sale and resale market. This could possibly due to the implementation of cooling measures in 2009 that aims to prevent speculative buying from the investors. From the graph, it seems that speculators tend to invest more in Condominium and Apartment as compared to other private residential properties.
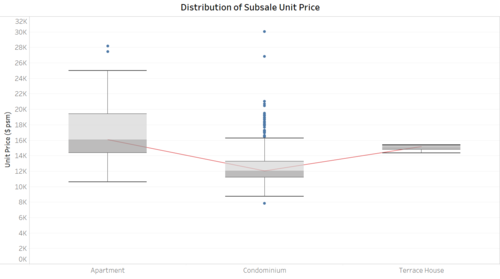
There is also an increasing trend of speculative buyers for Condominium in 2015. This could possibly due to a lower median unit price as compared to Apartment and Terrace House as observed from the box plot above which can be due to a greater condominium supply in the housing market which drives down prices. As for Apartment, the number of subsale transactions peak at the second quarter of 2015 before it decreases in the third and fourth quarter of 2015.
Semi-detached house data will be excluded from the box plot there is only one semi-detached house transaction which will not be useful in the box plot diagram. There are no detached house sub-sale data in 2015. After excluding semi-detached data from box plot, we can observe that there is a greater variation for the median unit prices for the remaining 3 properties. There are more outliers observed from Condominium as compared to Apartment. This suggests that the sub-sale market for condominium is more unpredictable than Apartment. Terrace House has a relatively short box plot which imply that the unit prices do not vary much.
4.2 Subsale Per Property Type and Planning Region
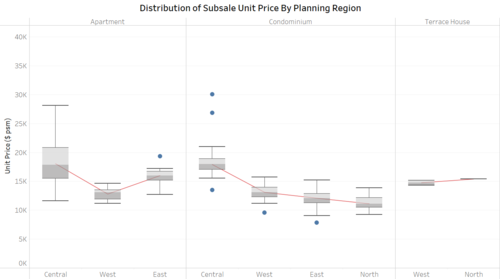
By looking at the box plot of subsale sale unit price by planning region, there are lesser variations in the location of the properties transacted in the subsale market as compared to the new sale and resale market. For Condominium, the median unit price is relatively the same for locations other than the central area.
5.Policies Recommendations
An increasing trend of speculative buyers for Condominium in 2015 is a cause of concern as it suggests that speculators tend to favour Condominium for their portfolio investments. This imply that speculators might be exploiting the loop holes in the cooling measures to enable them to embark on speculative buying for Condominiums.
5.1 Revision of Cooling Measures Policies
Relevant government organisations might want to monitor closely if this increasing trend is observed in 2016. If this continues, a revision of the cooling measures might be necessary, such as introduction of tighter regulations for buyers, in order to prevent an overheated Condominium market.
5.2 Promote Alternative Investments Opportunities
Relevant government organisations might want to look into public education to promote other promising investment vehicles in order to divert the speculators attention away from the real estate market. The Monetary Authority of Singapore can also look into developing markets for alternative investments in order to reduce excessive speculation in the Condominium market.
Inforgraphics
References
1. Goh, G. (2016, July 13). Property cooling measures 'unlikely to be eased this year'. The Straits Times. Retrieved from http://www.straitstimes.com/business/cooling-measures-unlikely-to-be-eased-this-year
2. Ku, S. Y. (2015, January 16). Enough home supply for up to 2030. TODAYonline. Retrieved from http://www.todayonline.com/business/property/enough-home-supply-2030
3. Ong, C. (2015, January 2). What to expect for Singapore private property prices in 2015. The Straits Times. Retrieved from http://www.straitstimes.com/business/what-to-expect-for-singapore-private-property-prices-in-2015
4. Singapore Business Review. (2016, March 18). Property cooling measures to be eased in Q4: report. Singapore Business Review. Retrieved from http://sbr.com.sg/residential-property/news/property-cooling-measures-be-eased-in-q4-report
