IS428 2016-17 Term1 Assign1 Dina Heng Li Gwek
Contents
Abstract
The focus of this article will be to observe the trends of private properties in Singapore. I will be working on meaningful visualization and charts to aid consumers in understanding the future trends and make better decisions. Potential home buyers can use my infographics to decide on which property to get to earn the highest profit should they intend to sell it in the near future. However, I would like to emphasize that this is not a one-size-fit-it-all prediction model as there are multiple external factors that come into play such as economic factors and government policies.
Problem and Motivation
There has been an oversupply of residential properties in 2015. This could be due to the fact that government has been putting in place cooling measures to keep the property prices low to prevent the property bubble burst. There has always been a demand for residential properties in Singapore. The question is: whether the supply has far exceeded the demand? Therefore, this project helps us to understand and analyze to see if there has been an oversupply of residential property in Singapore and discuss if the Singapore government should lift the cooling measures in order to save the property market in Singapore.
Approaches
Three patterns of the share of the private properties supply in 2015
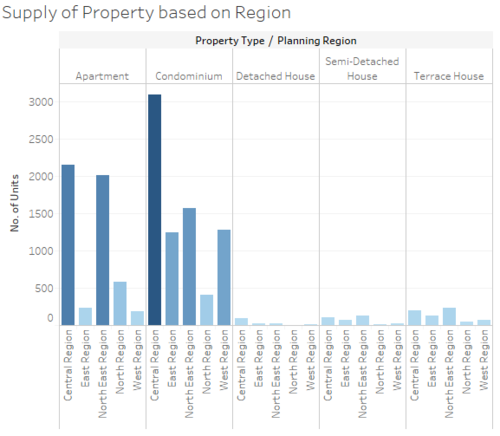
1. Condominium Always has the Highest Supply Throughout All Quarters
The next most popular supply is Apartment. It seems like developers prefer to develop these two housing types. Let’s look into why later.
2. Central Region is the Most Populated
You can see that condos stand the highest in the central region. I can assume that developers prefer to develop there because it sells the highest price. I think the central is overpopulated with condominiums.
3. Apartment and Condominium Form the Majority of the Private Properties Supply in Singapore
It makes sense that the rest of the houses form the least percentage because it takes up the most space.
For Property Type detached house, semi-detached house and Terrace House, you can see that they’re not being built much due to the land constraint in Singapore.
Identify three patterns of the distribution of the private properties prices in 2015
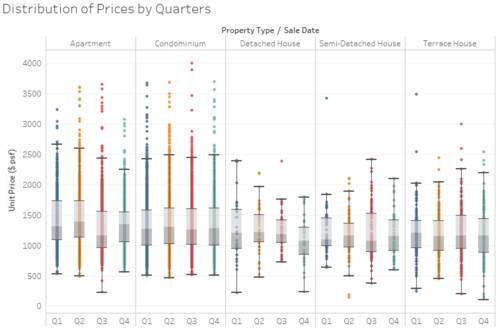
1. Prices for Condominiums are the Highest!
To find out the distribution of the private property prices in 2015, I’ve used a box plot because it will best illustrate the distribution. As you can see, the prices are pretty well-distributed (not skewed in any way).
Another observation is that the unit price of condominium is the highest. Condominium also has one of the largest range. The true power of boxplot analysis is it allows us to compare across a category. For example, the boxplots above not only showing us the unit prices of the different property types, but they also reveal the distributions of these products. In addition, the boxplot also indicates that there are several statistical outliers.
Next, to gain a better understanding of the distribution of properties prices in different quarters Singapore in 2015, I further segregated it into different quarters.
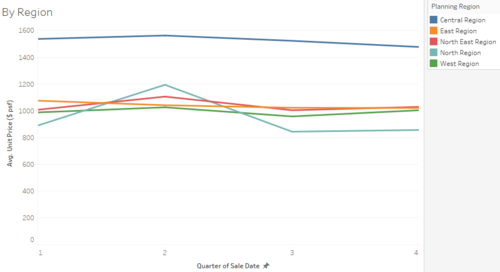
2. The Central Region is the Most Expensive Region
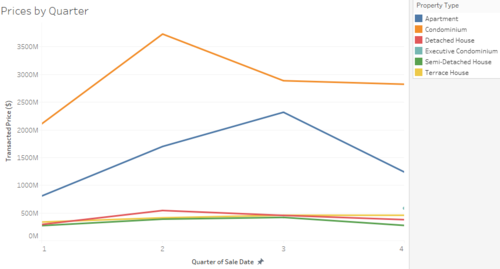
3. General Downward Trend of Properties Prices
Policy Recommendations
Given that the government has put in place policies and implemented measures to cool the property prices in Singapore, there are still a lot of property unsold due to oversupply.
These are my policy recommendations for 2016:
1. Limit the development of condominiums by imposing tariffs.
2. Most supply of properties come from the central region. URA should pull back land sales i.e. reduce land supply of the central region if not it will become overpopulated.
3. Since prices are not dropping as fast as the increase in supply of residential properties in Singapore, the government should continue or increase the cooling measures to till the profits becomes minimal. If not, there will be an oversupply of properties which does not do good to the economy.
Tools Utilized
Excel 2016: To prepare data and perform data transformation
Tableau: Visual representation by drawing up graphs and charts
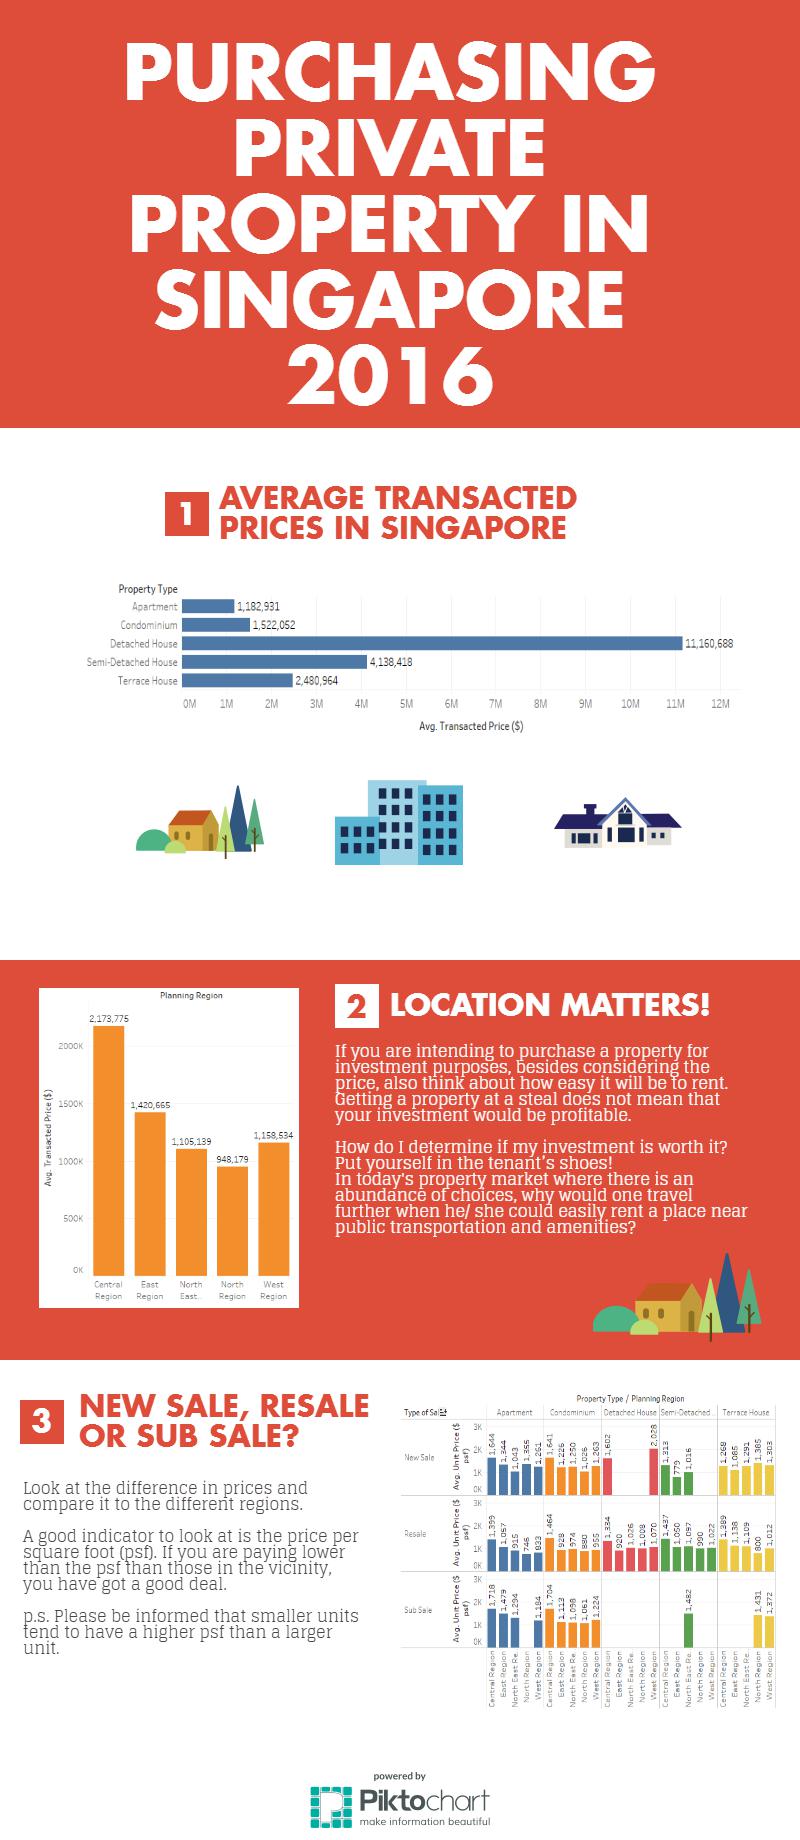
Piktochart: Created an infographic
